第 2 章 条形图
2.1 基本条形图
# data
data <- data.frame(
  name=c("A","B","C","D","E") ,
  value=c(3,12,5,18,45)
  )

# Barplot
ggplot(data, aes(x=name, y=value)) +
  geom_bar(stat = "identity")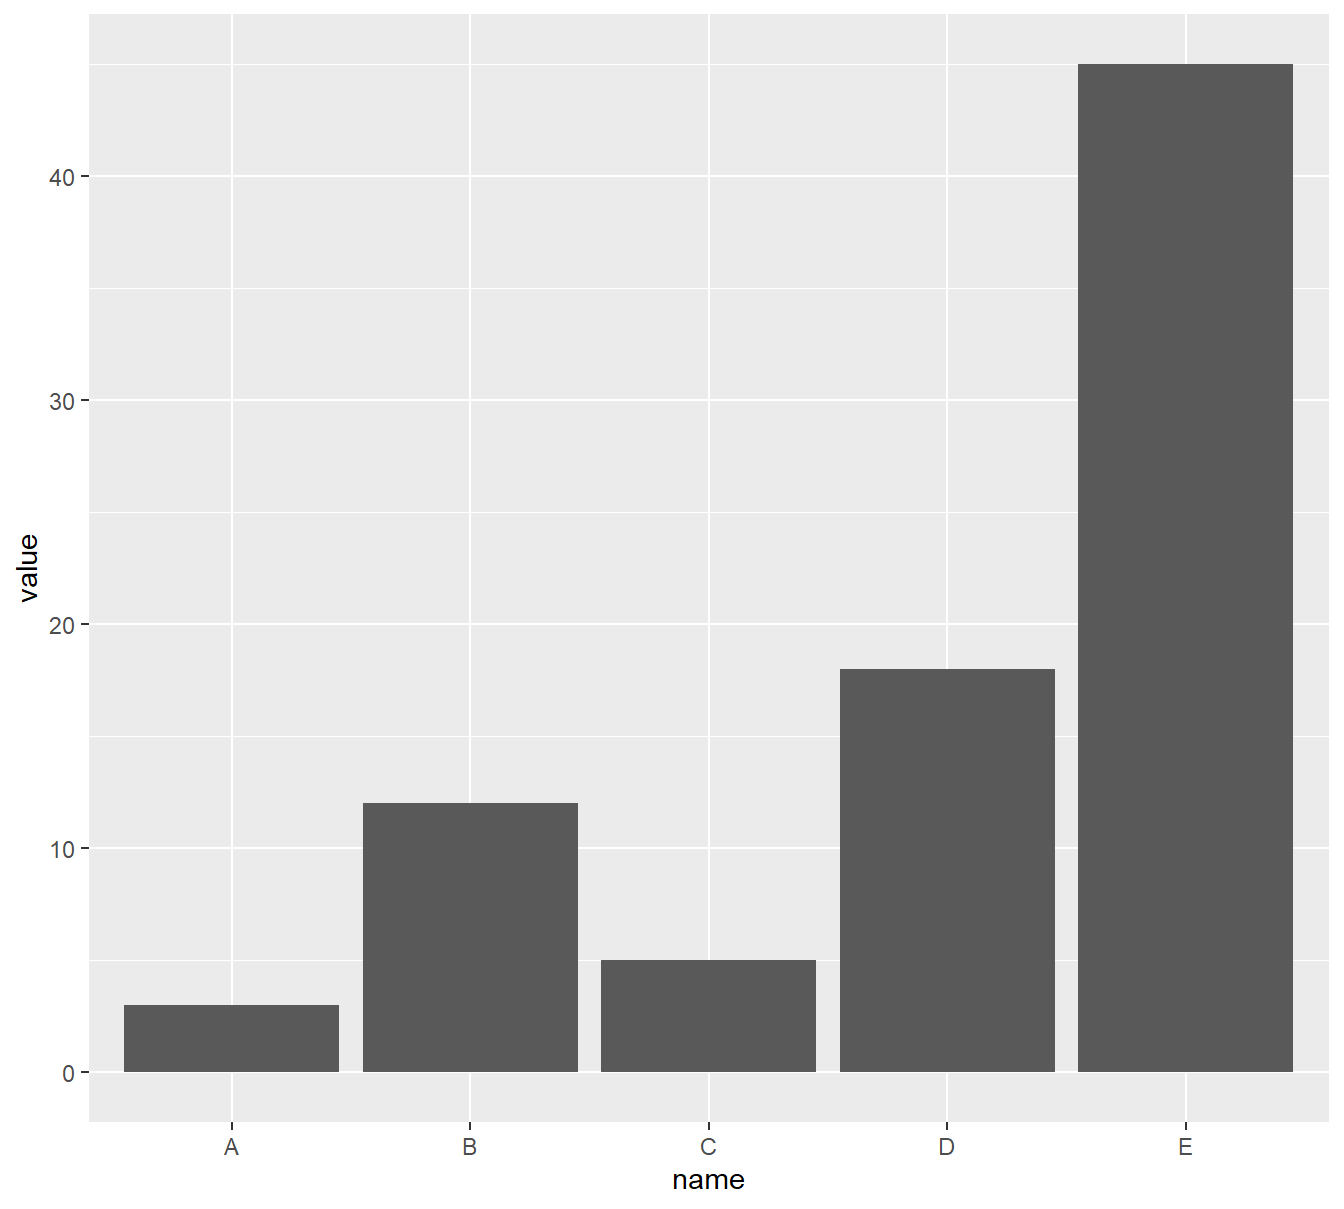
2.1.1 条形宽度
- 指定宽度
data <- data.frame(
  name=c("A","B","C","D","E") ,
  value=c(3,12,5,18,45)
  )

ggplot(data, aes(x=name, y=value)) +
geom_bar(stat = "identity", width=0.2) 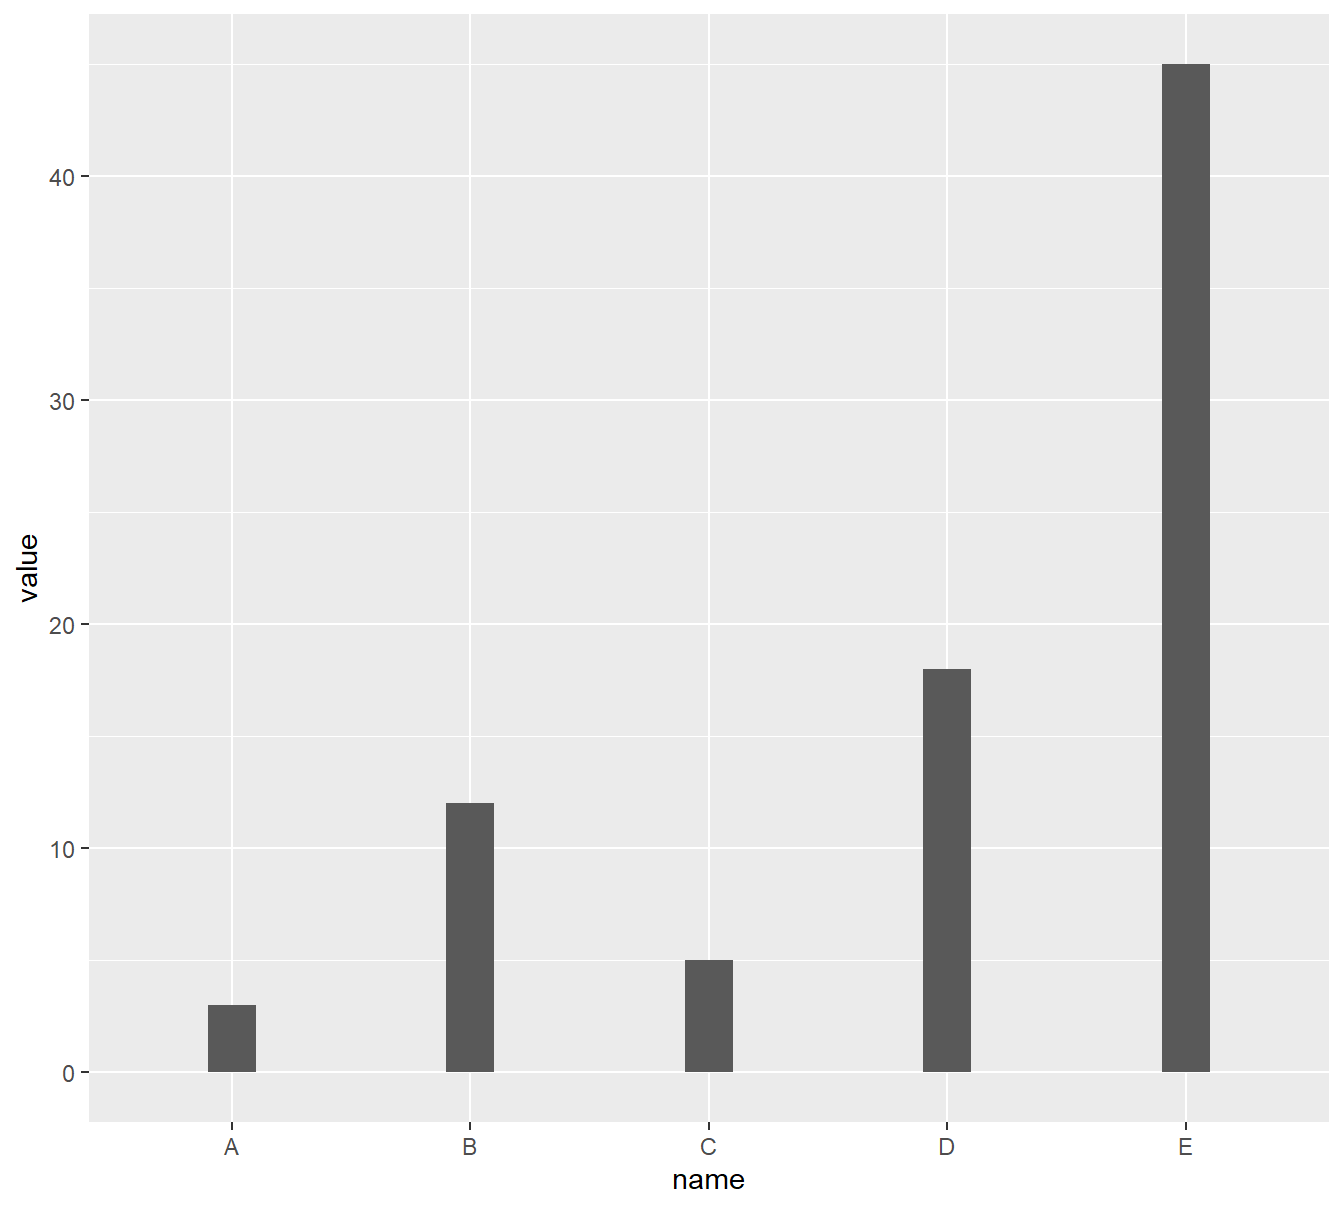
- 可变宽度
data <- data.frame(
  group=c("A ","B ","C ","D ") ,
  value=c(33,62,56,67) ,
  number_of_obs=c(100,500,459,342)
)

# Calculate the future positions on the x axis of each bar (left border, central position, right border)
data$right <- cumsum(data$number_of_obs) + 30*c(0:(nrow(data)-1))
data$left <- data$right - data$number_of_obs

# Plot
ggplot(data, aes(ymin = 0)) +
    geom_rect(aes(xmin = left, xmax = right, ymax = value, colour = group, fill = group)) +
    xlab("number of obs") +
    ylab("value") +
    theme_ipsum() +
theme(legend.position="none") 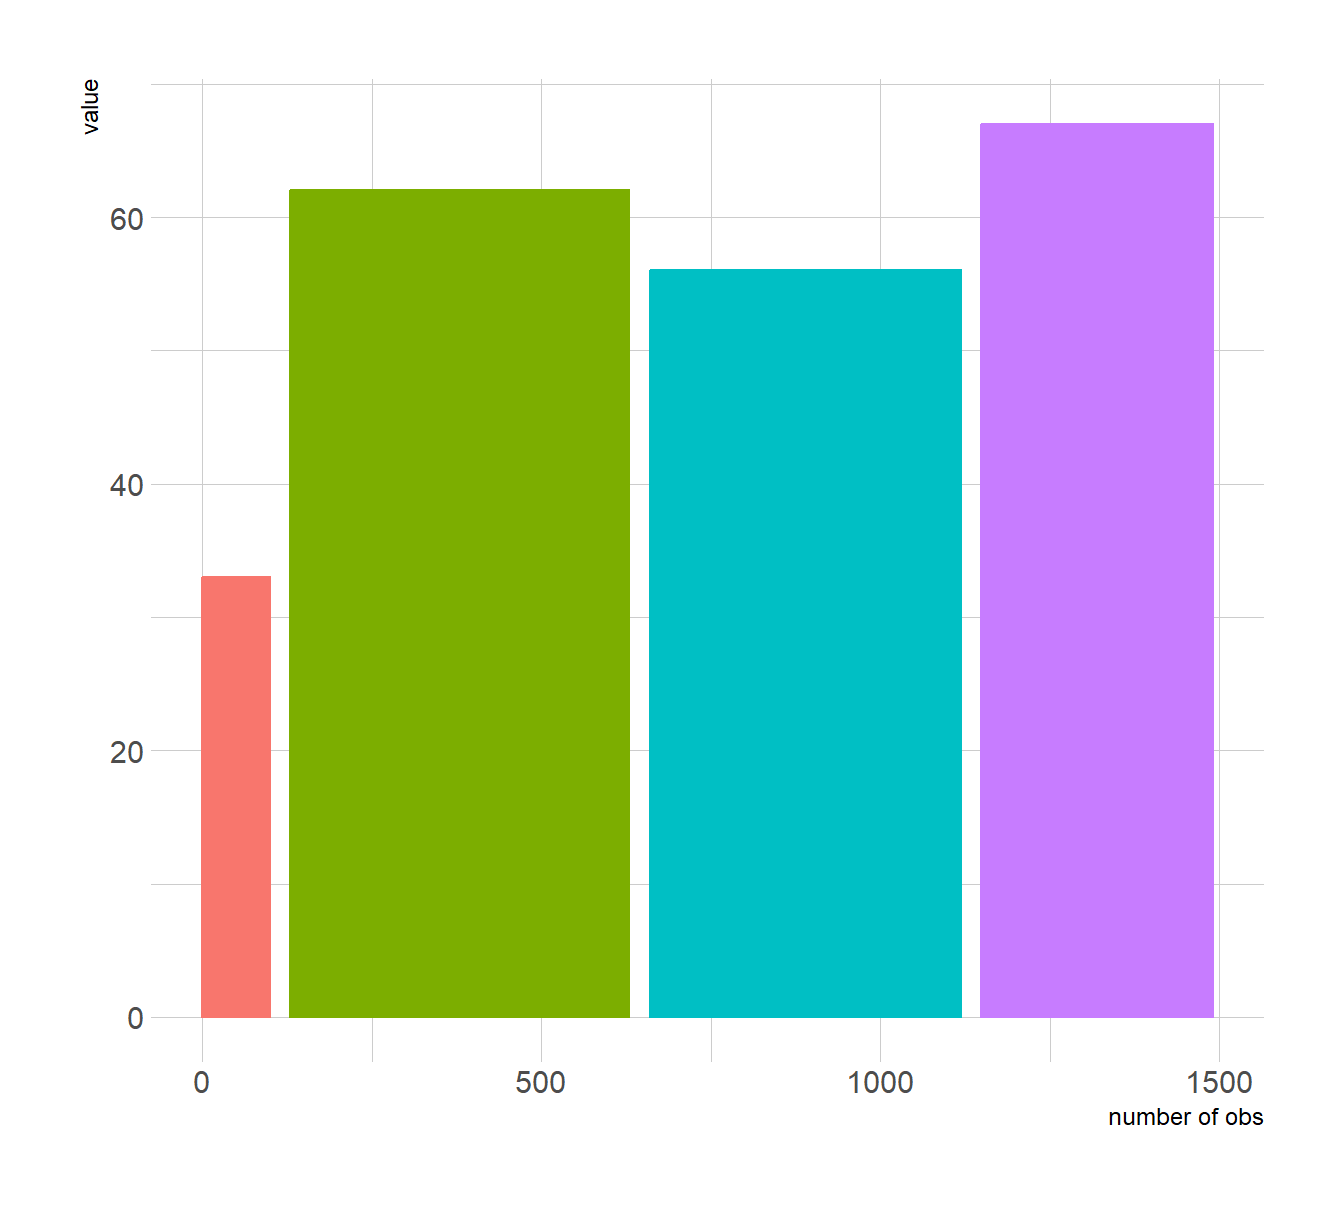
2.1.2 条形图配色
# 1: uniform color. Color is for the border, fill is for the inside
ggplot(mtcars, aes(x=as.factor(cyl) )) +
  geom_bar(color="blue", fill=rgb(0.1,0.4,0.5,0.7) ) -> p1

# 2: Using Hue
ggplot(mtcars, aes(x=as.factor(cyl), fill=as.factor(cyl) )) +
  geom_bar( ) +
  scale_fill_hue(c = 40) +
  theme(legend.position="none") -> p2

# 3: Using RColorBrewer
ggplot(mtcars, aes(x=as.factor(cyl), fill=as.factor(cyl) )) +
  geom_bar( ) +
  scale_fill_brewer(palette = "Set1") +
  theme(legend.position="none") -> p3

# 4: Using greyscale:
ggplot(mtcars, aes(x=as.factor(cyl), fill=as.factor(cyl) )) +
  geom_bar( ) +
  scale_fill_grey(start = 0.25, end = 0.75) +
  theme(legend.position="none") -> p4

# 5: Set manualy
ggplot(mtcars, aes(x=as.factor(cyl), fill=as.factor(cyl) )) +
  geom_bar( ) +
  scale_fill_manual(values = c("red", "green", "blue") ) +
  theme(legend.position="none") -> p5
ggarrange(p1,p2,p3,p4,p5,labels = c("p1","p2","p3","p4","p5"))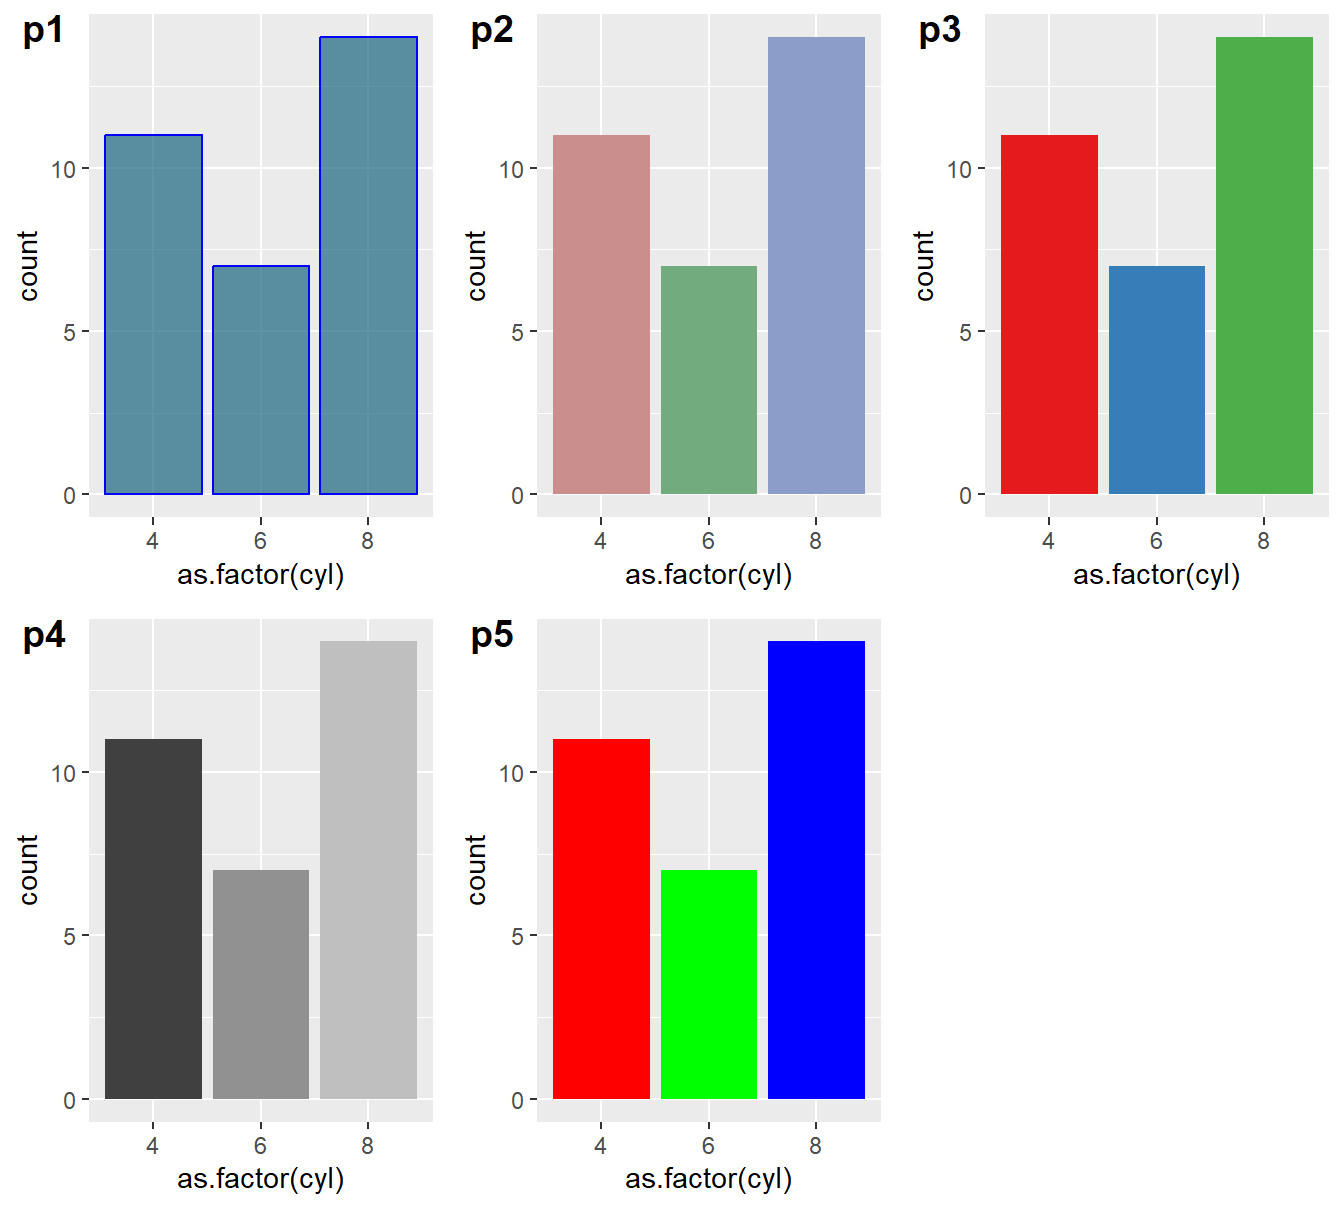
2.2 分组条形图
# create a dataset
specie <- c(rep("sorgho" , 3) , rep("poacee" , 3) , rep("banana" , 3) , rep("triticum" , 3) )
condition <- rep(c("normal" , "stress" , "Nitrogen") , 4)
value <- abs(rnorm(12 , 0 , 15))
data <- data.frame(specie,condition,value)

# Grouped
ggplot(data, aes(fill=condition, y=value, x=specie)) +
    geom_bar(position="dodge", stat="identity")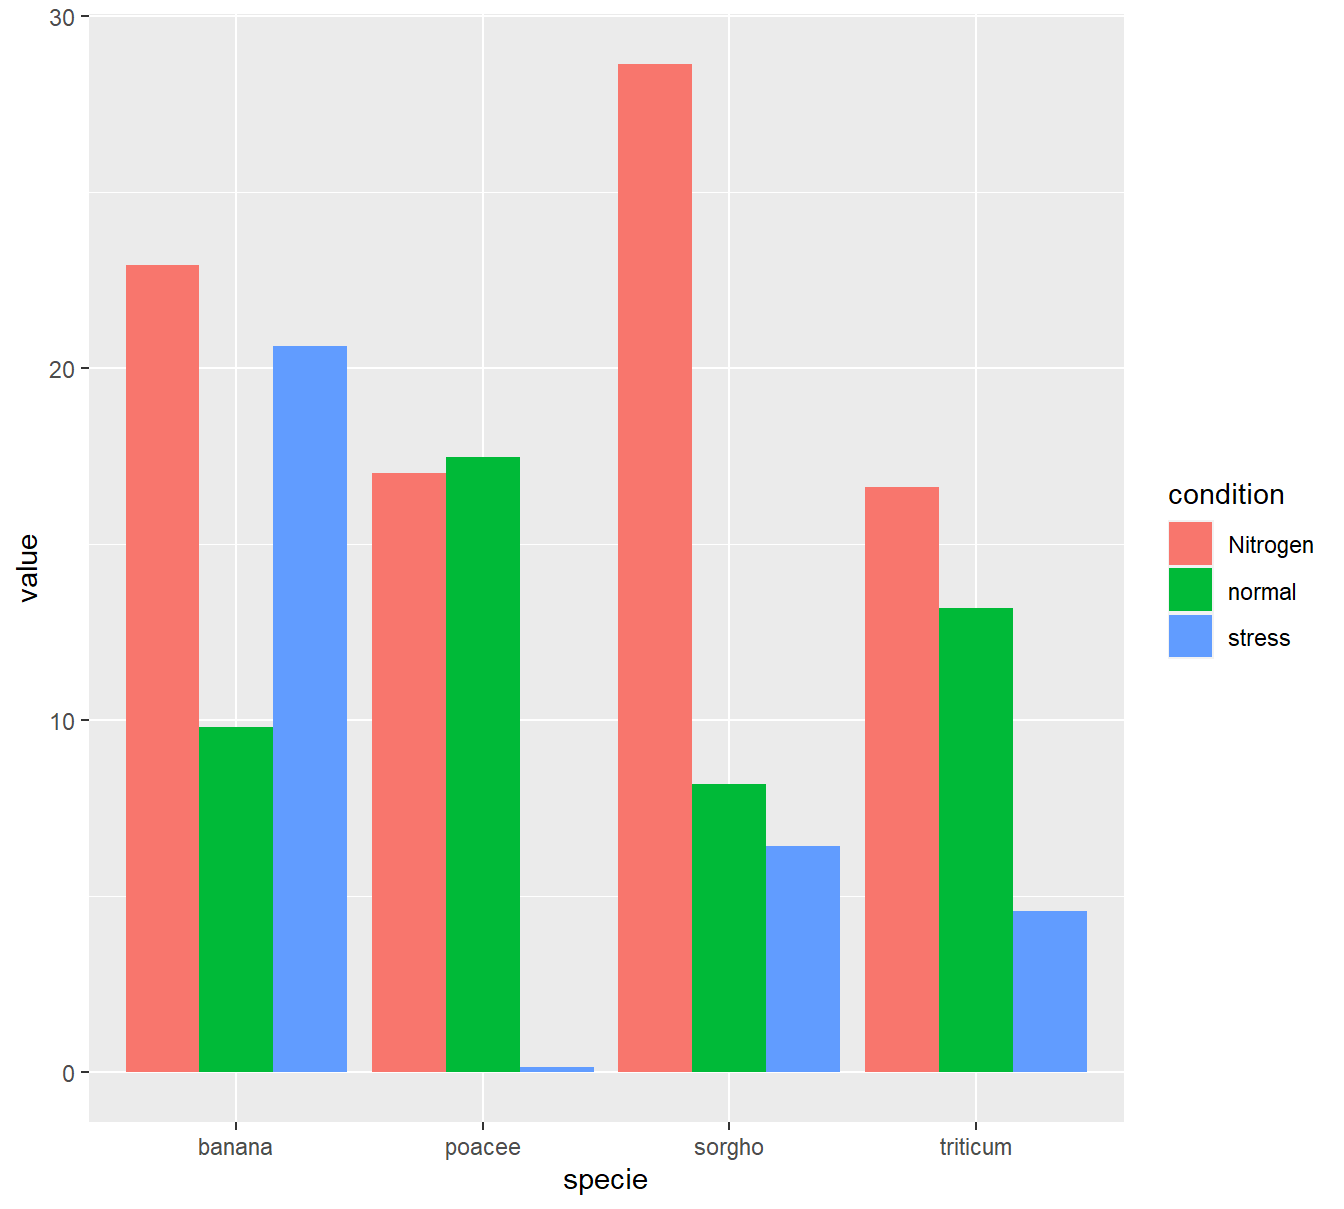
2.3 叠堆条形图
specie <- c(rep("sorgho" , 3) , rep("poacee" , 3) , rep("banana" , 3) , rep("triticum" , 3) )
condition <- rep(c("normal" , "stress" , "Nitrogen") , 4)
value <- abs(rnorm(12 , 0 , 15))
data <- data.frame(specie,condition,value)

# Stacked
ggplot(data, aes(fill=condition, y=value, x=specie)) +
    geom_bar(position="stack", stat="identity")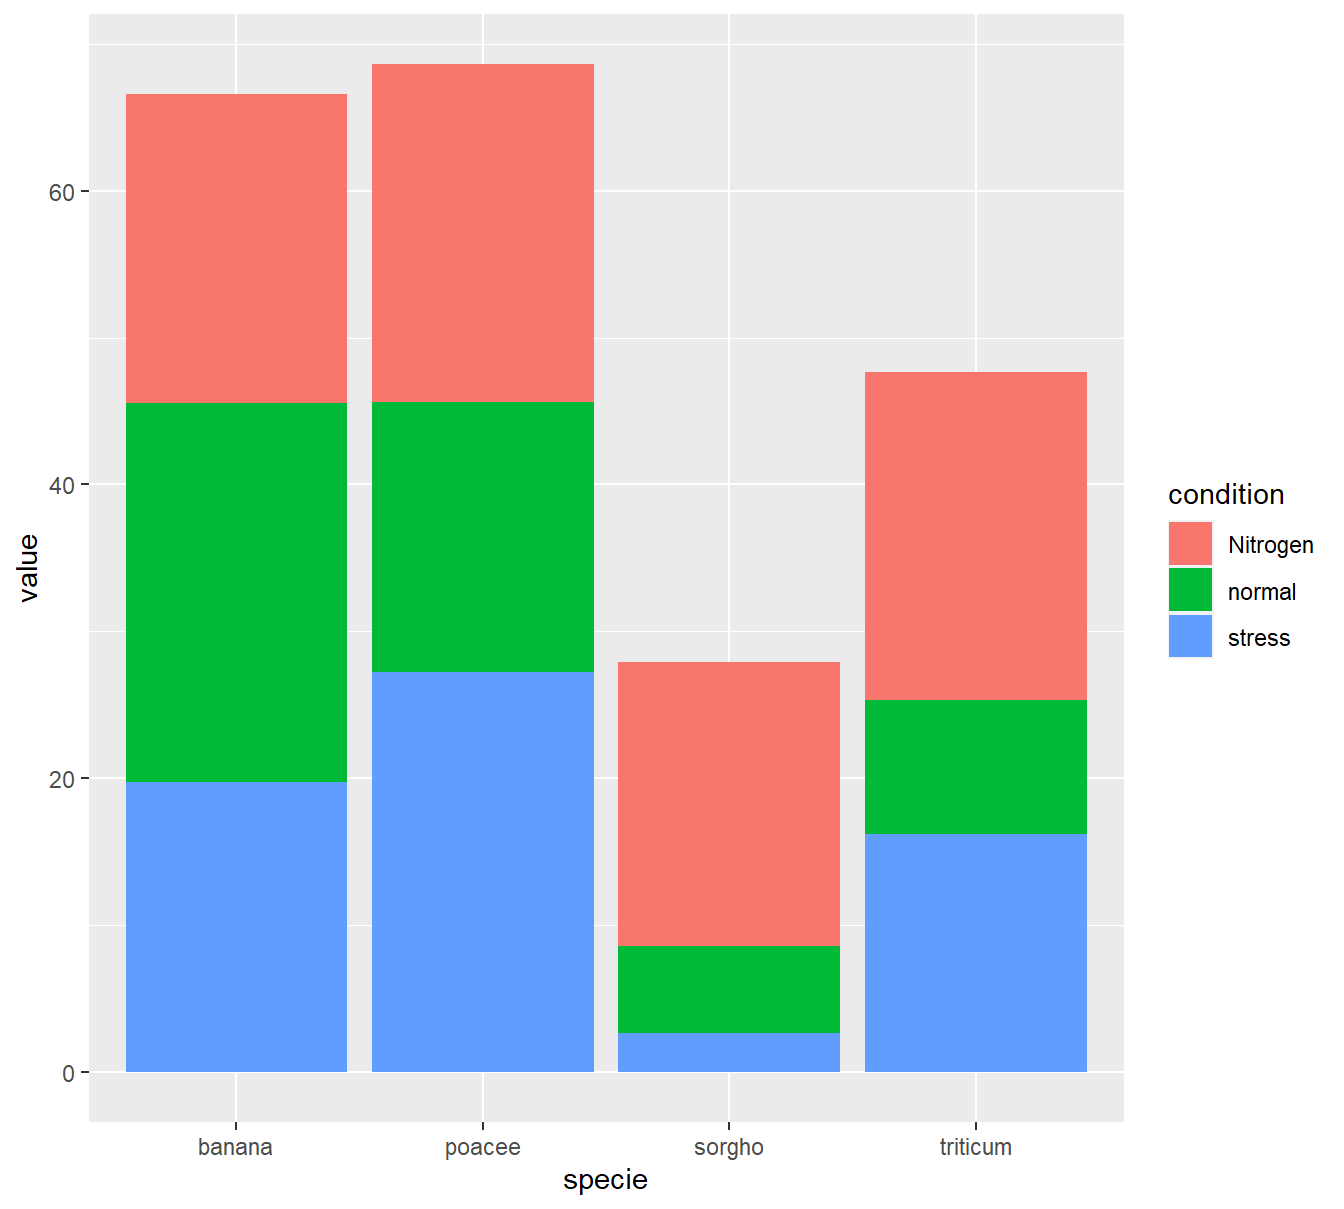
# Stacked + percent
ggplot(data, aes(fill=condition, y=value, x=specie)) +
geom_bar(position="fill", stat="identity")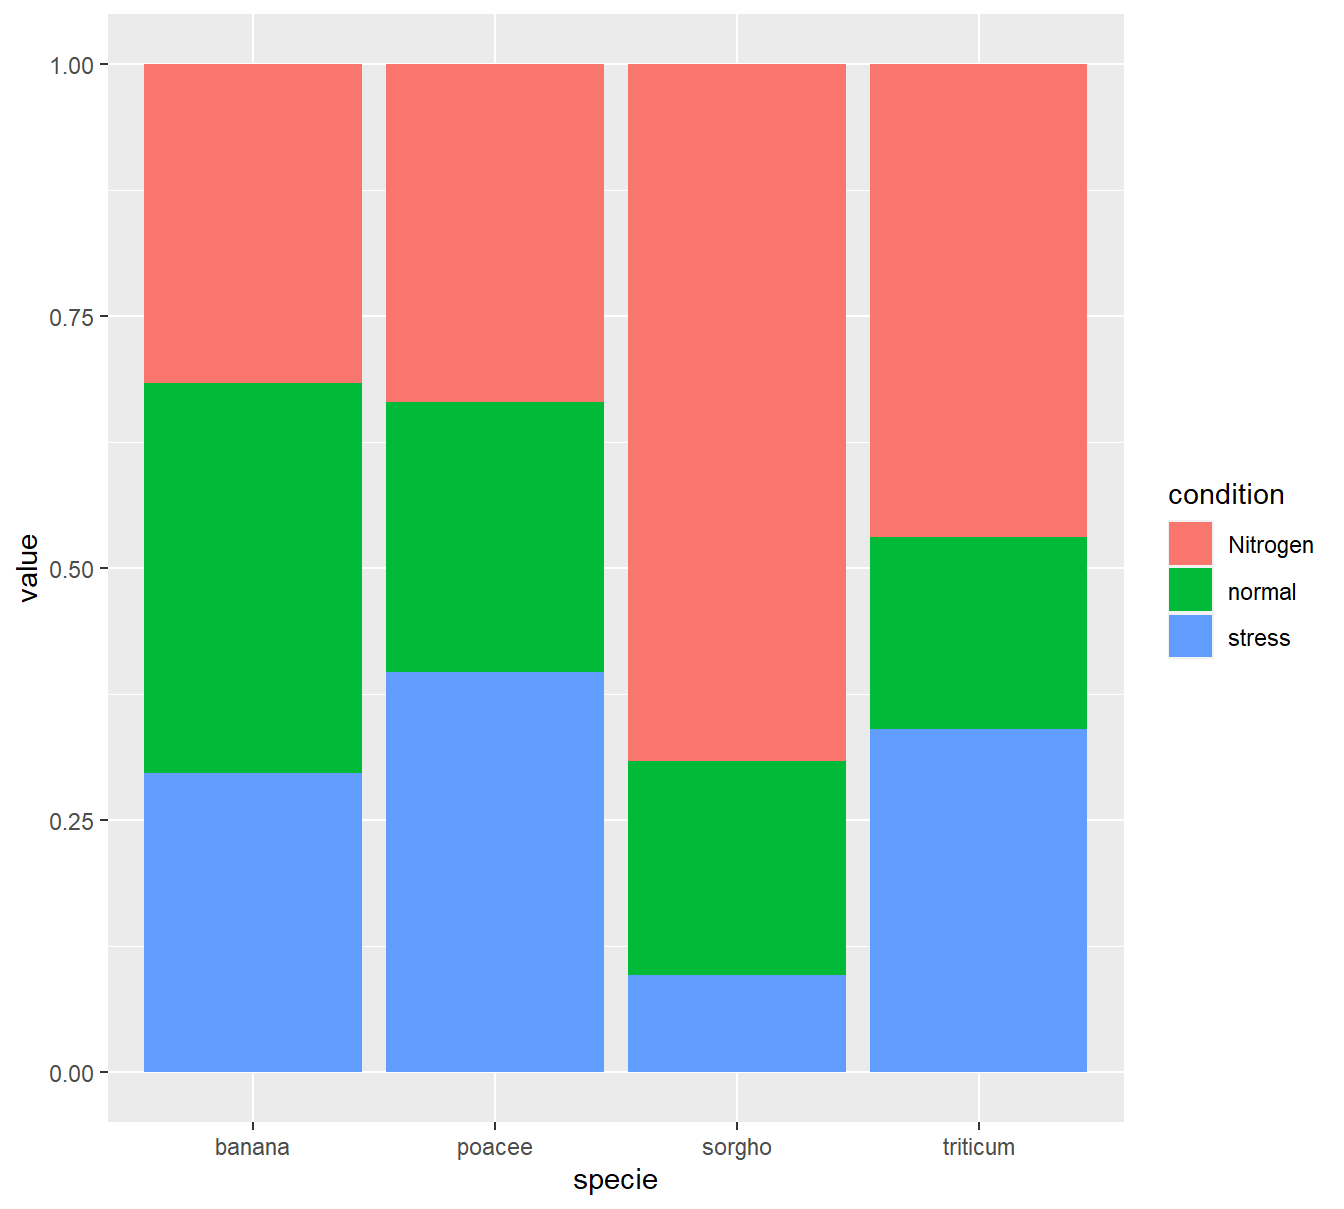 ### 自定义样式
# create a dataset
specie <- c(rep("sorgho" , 3) , rep("poacee" , 3) , rep("banana" , 3) , rep("triticum" , 3) )
condition <- rep(c("normal" , "stress" , "Nitrogen") , 4)
value <- abs(rnorm(12 , 0 , 15))
data <- data.frame(specie,condition,value)

#  样式
ggplot(data, aes(fill=condition, y=value, x=specie)) +
    geom_bar(position="stack", stat="identity") +
    scale_fill_viridis(discrete = T) +
    ggtitle("Studying 4 species..") +
    theme_ipsum() +
    xlab("")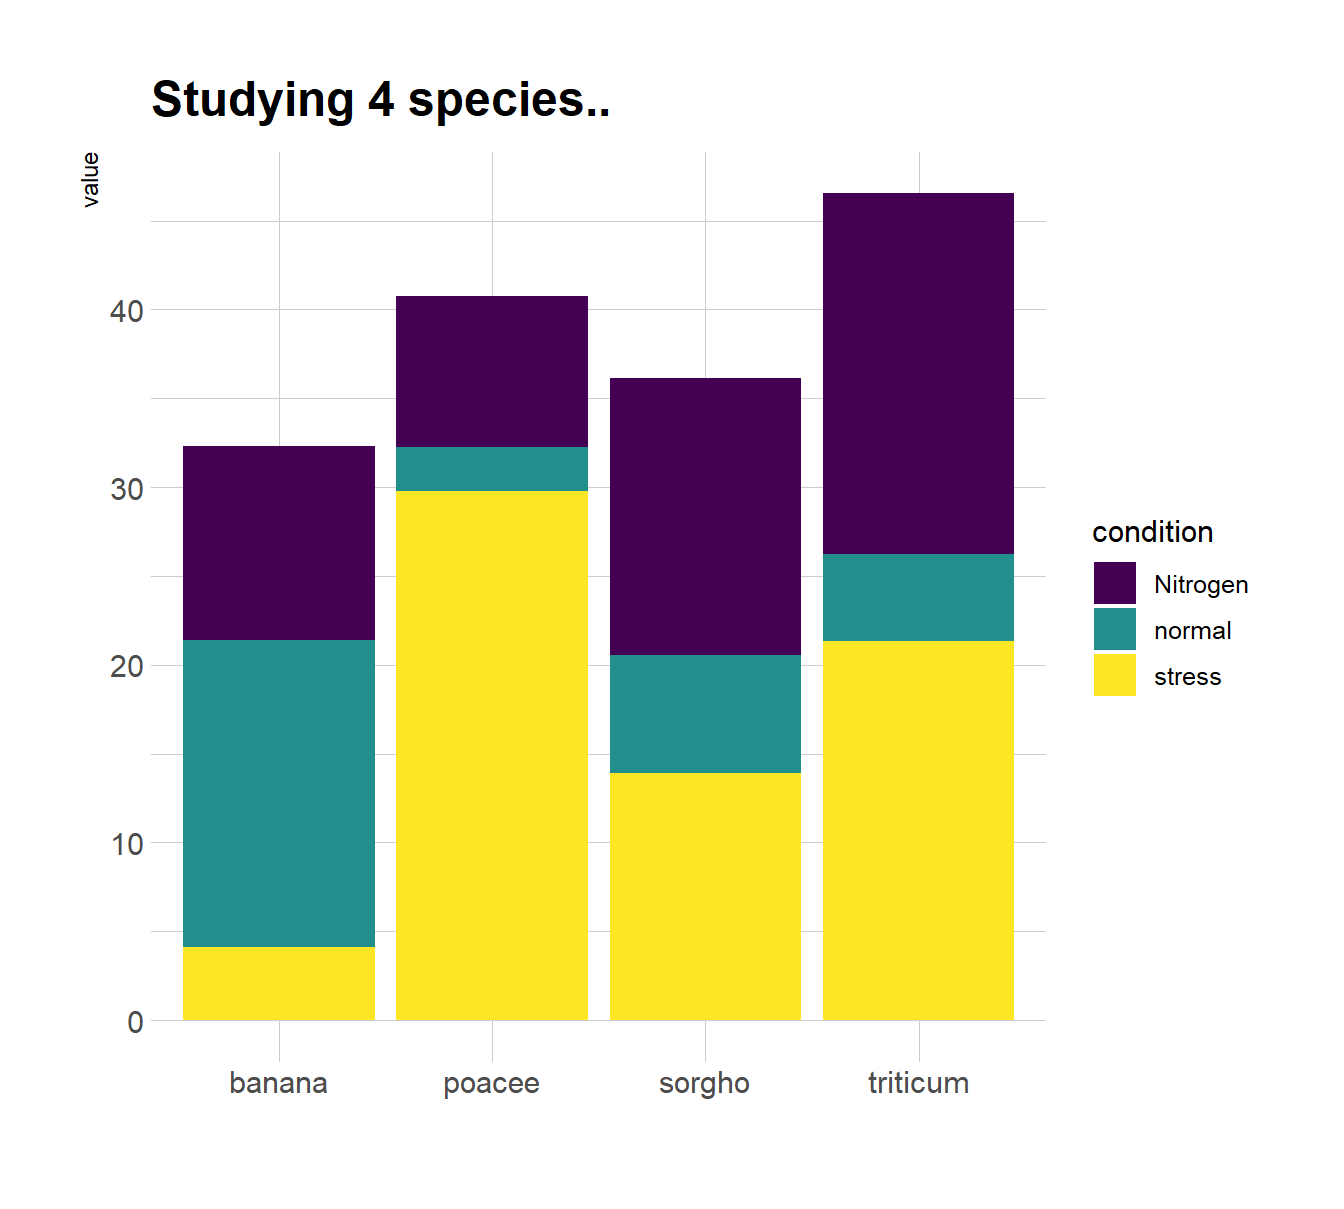
# 分面
ggplot(data, aes(fill=condition, y=value, x=condition)) +
    geom_bar(position="dodge", stat="identity") +
    scale_fill_viridis(discrete = T, option = "E") +
    ggtitle("Studying 4 species..") +
    facet_wrap(~specie) +
    theme_ipsum() +
    theme(legend.position="none") +
    xlab("")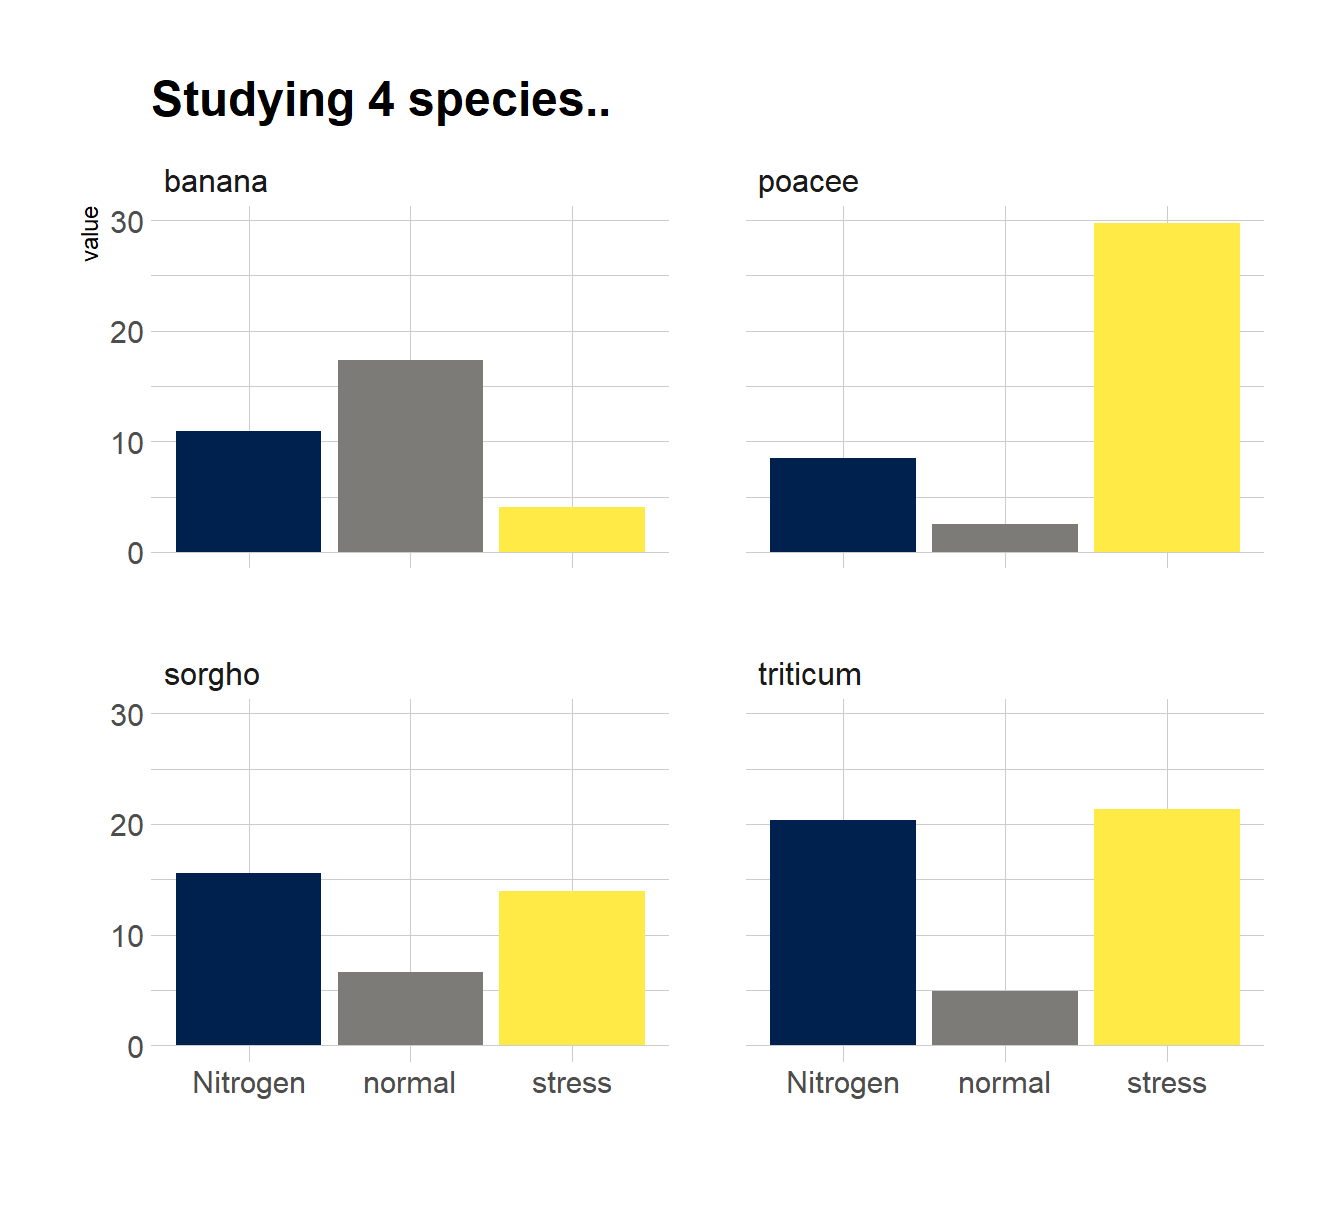
2.4 水平条形图
data <- data.frame(
  name=c("A","B","C","D","E") ,
  value=c(3,12,5,18,45)
  )
# Barplot
ggplot(data, aes(x=name, y=value)) +
  geom_bar(stat = "identity") +
  coord_flip()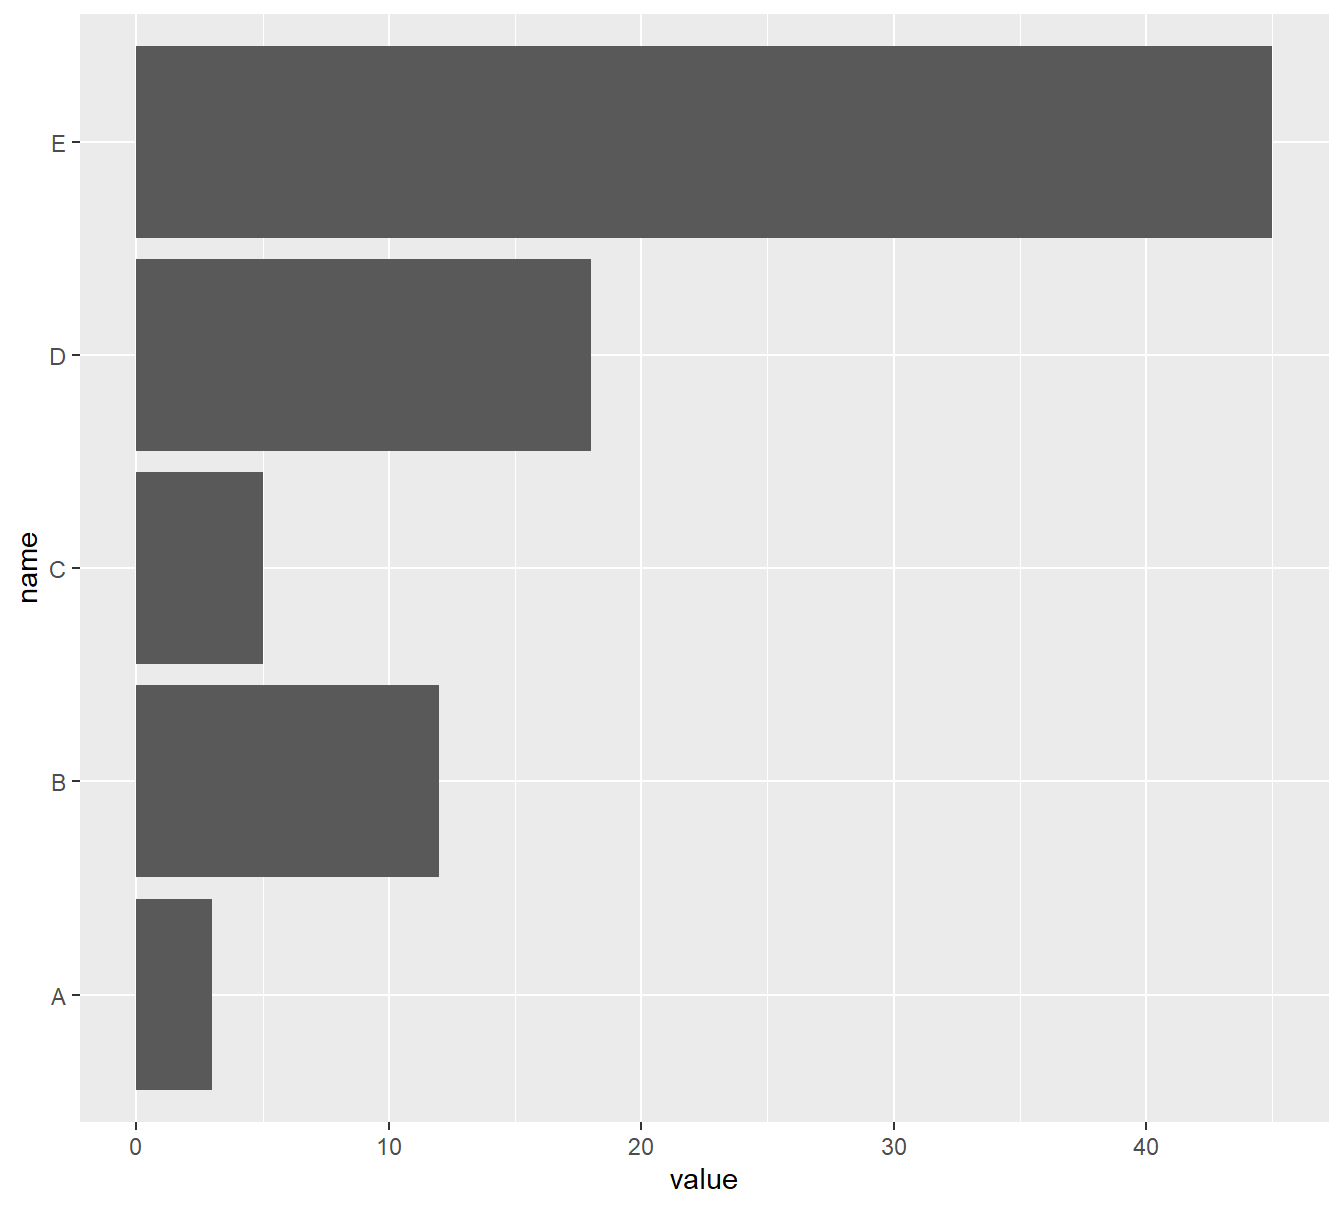
2.5 带负值的条形图
data <- read.csv("Datas/stacked_barplot_negative_values.csv")

data_long <- gather(data, group, value, groupA:groupD) %>%
  arrange(factor(x, levels = c("Jan", "Feb", "Mar", "Apr", "May", "Jun", "Jul", "Aug", "Sept", "Oct"))) %>%
  mutate(x=factor(x, levels=unique(x)))

head(data_long,5)
## x group value
## 1 Jan groupA 12
## 2 Jan groupB 19
## 3 Jan groupC -9
## 4 Jan groupD 2
## 5 Feb groupA 16# plot
ggplot(data_long, aes(fill=group, y=value, x=x)) +
geom_bar(position="stack", stat="identity")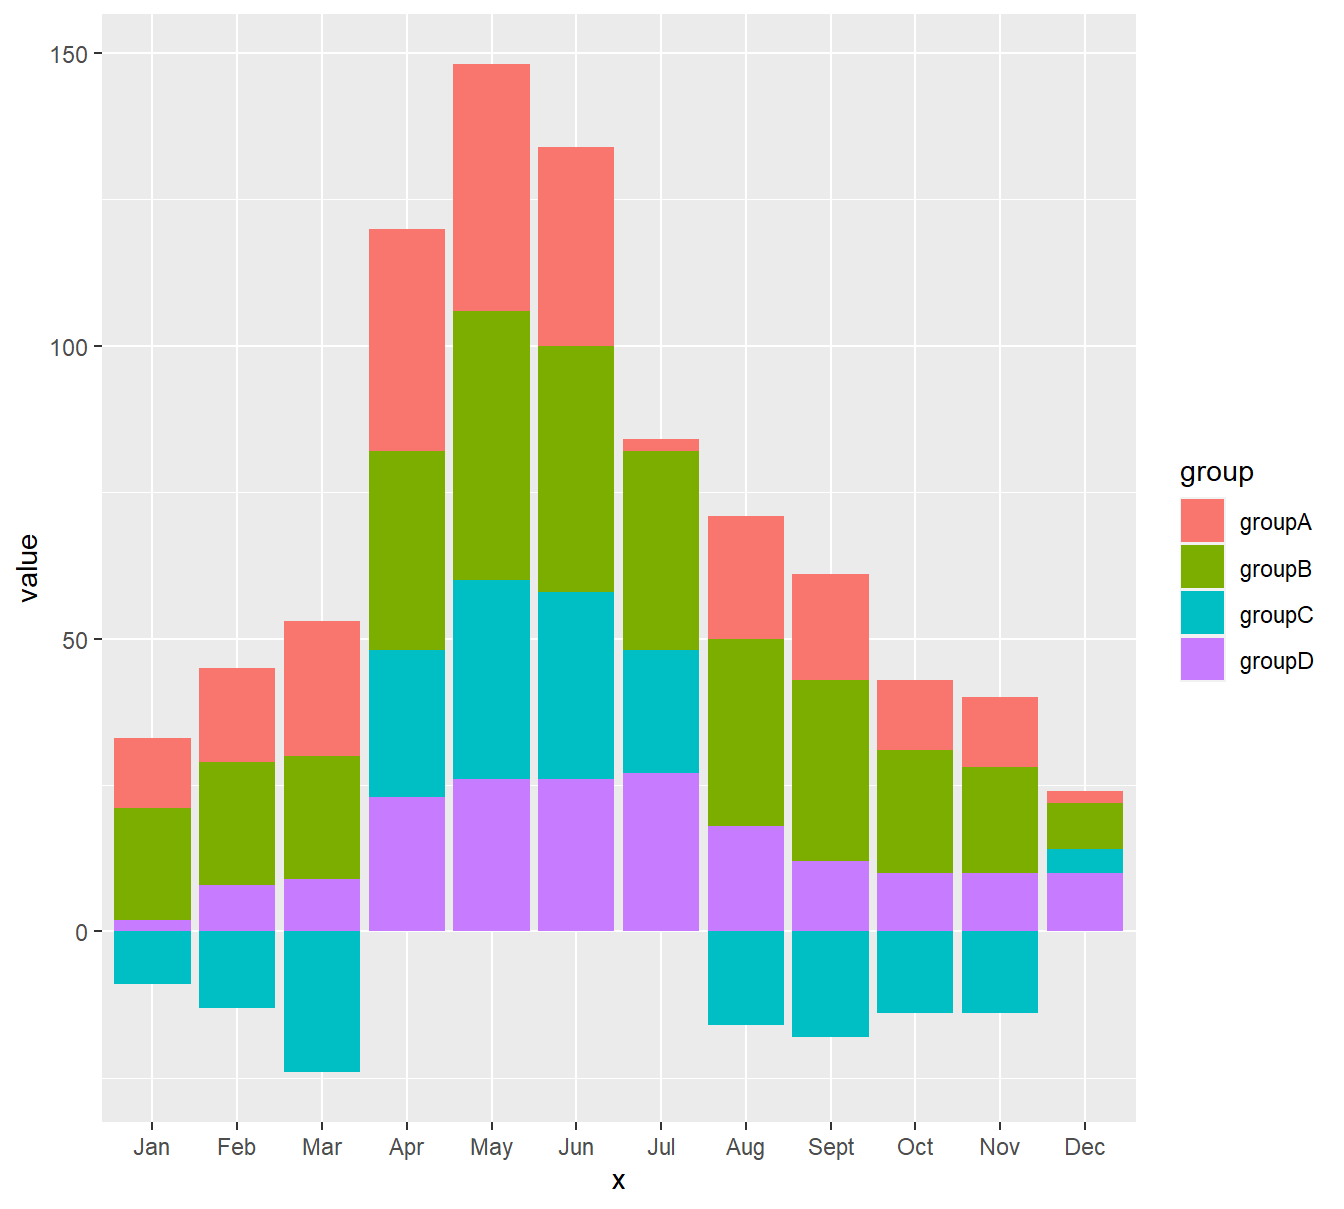
2.6 带误差的条形图
- SD
# create dummy data
data <- data.frame(
  name=letters[1:5],
  value=sample(seq(4,15),5),
  sd=c(1,0.2,3,2,4)
)

# Most basic error bar
ggplot(data) +
    geom_bar( aes(x=name, y=value), stat="identity", fill="skyblue", alpha=0.7) +
    geom_errorbar( aes(x=name, ymin=value-sd, ymax=value+sd), width=0.4, colour="orange", alpha=0.9, size=1.3) -> p1


# rectangle
ggplot(data) +
  geom_bar( aes(x=name, y=value), stat="identity", fill="skyblue", alpha=0.5) +
  geom_crossbar( aes(x=name, y=value, ymin=value-sd, ymax=value+sd), width=0.4, colour="orange", alpha=0.9, size=1.3)-> p2

# line
ggplot(data) +
  geom_bar( aes(x=name, y=value), stat="identity", fill="skyblue", alpha=0.5) +
  geom_linerange( aes(x=name, ymin=value-sd, ymax=value+sd), colour="orange", alpha=0.9, size=1.3)-> p3

# line + dot
ggplot(data) +
  geom_bar( aes(x=name, y=value), stat="identity", fill="skyblue", alpha=0.5) +
  geom_pointrange( aes(x=name, y=value, ymin=value-sd, ymax=value+sd), colour="orange", alpha=0.9, size=1.3)-> p4

# horizontal
ggplot(data) +
  geom_bar( aes(x=name, y=value), stat="identity", fill="skyblue", alpha=0.5) +
  geom_errorbar( aes(x=name, ymin=value-sd, ymax=value+sd), width=0.4, colour="orange", alpha=0.9, size=1.3) +
  coord_flip()-> p5
ggarrange(p1,p2,p3,p4,p5,labels = c("p1","p2","p3","p4","p5"))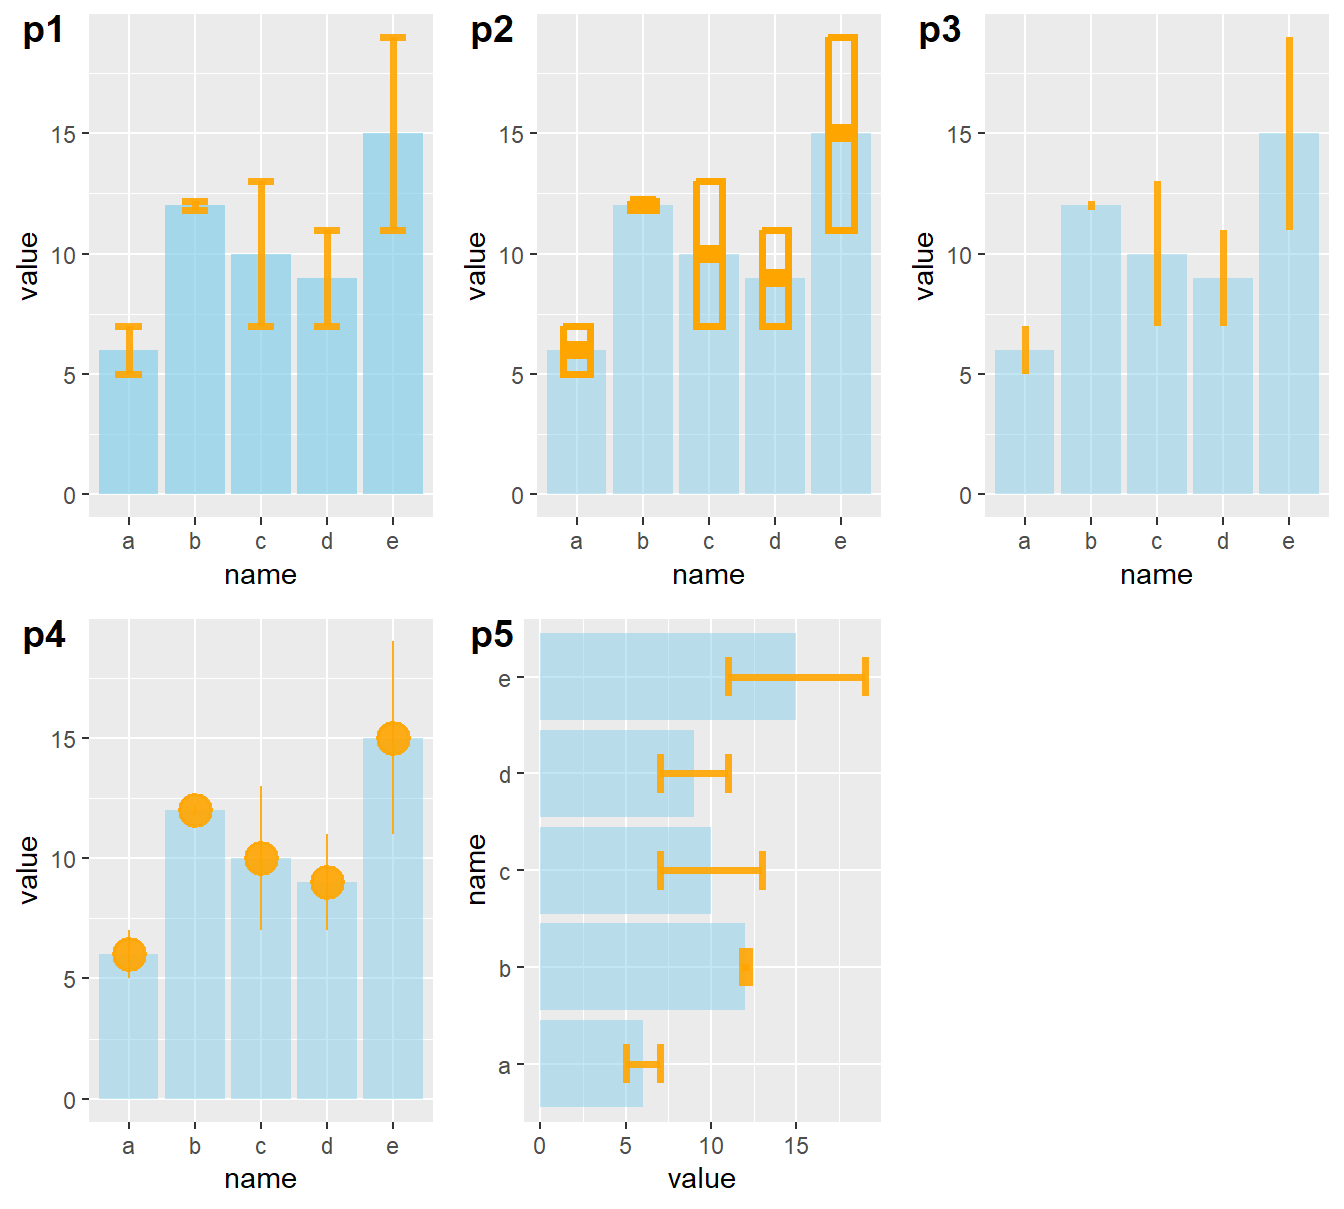
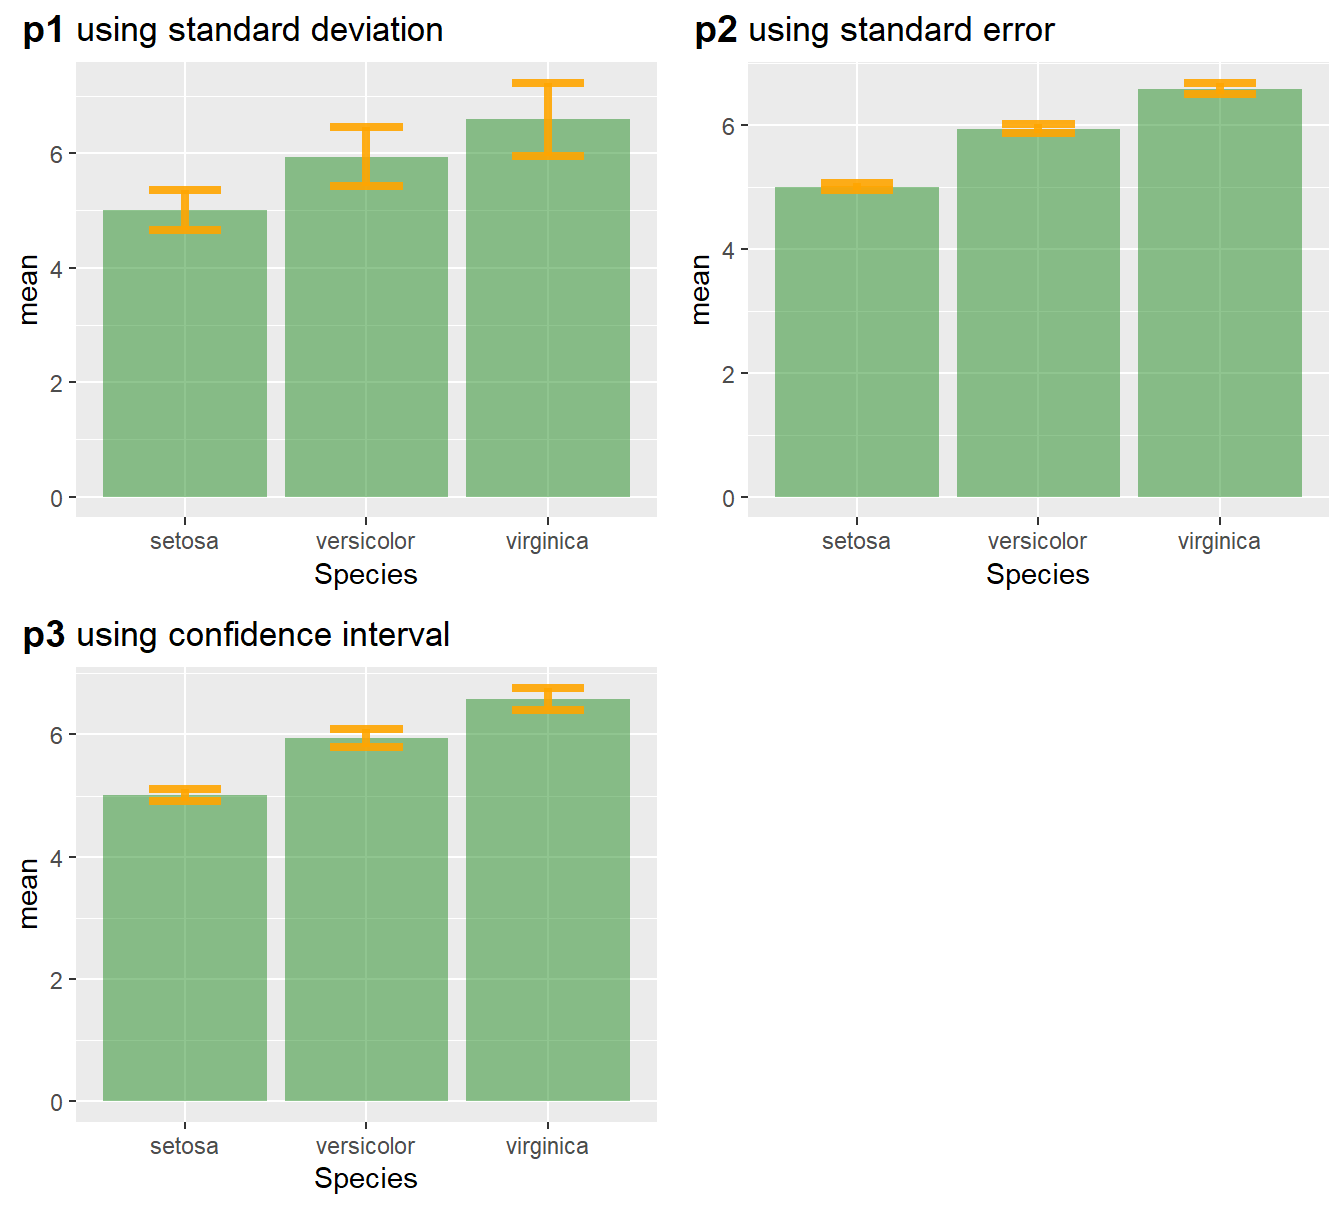
- SD,SE,IC
# Data
data <- iris %>% select(Species, Sepal.Length)

# Calculates mean, sd, se and IC
my_sum <- data %>%
  group_by(Species) %>%
  summarise(
    n=n(),
    mean=mean(Sepal.Length),
    sd=sd(Sepal.Length)
  ) %>%
  mutate( se=sd/sqrt(n))  %>%
  mutate( ic=se * qt((1-0.05)/2 + .5, n-1))

# Standard deviation
ggplot(my_sum) +
  geom_bar( aes(x=Species, y=mean), stat="identity", fill="forestgreen", alpha=0.5) +
  geom_errorbar( aes(x=Species, ymin=mean-sd, ymax=mean+sd), width=0.4, colour="orange", alpha=0.9, size=1.5) +
  ggtitle("using standard deviation") -> p1

# Standard Error
ggplot(my_sum) +
  geom_bar( aes(x=Species, y=mean), stat="identity", fill="forestgreen", alpha=0.5) +
  geom_errorbar( aes(x=Species, ymin=mean-se, ymax=mean+se), width=0.4, colour="orange", alpha=0.9, size=1.5) +
  ggtitle("using standard error")-> p2

# Confidence Interval
ggplot(my_sum) +
  geom_bar( aes(x=Species, y=mean), stat="identity", fill="forestgreen", alpha=0.5) +
  geom_errorbar( aes(x=Species, ymin=mean-ic, ymax=mean+ic), width=0.4, colour="orange", alpha=0.9, size=1.5) +
  ggtitle("using confidence interval")-> p3

ggarrange(p1,p2,p3,labels = c("p1","p2","p3"))