第 6 章 散点图
6.1 基本散点图
6.1.1 自定义样式
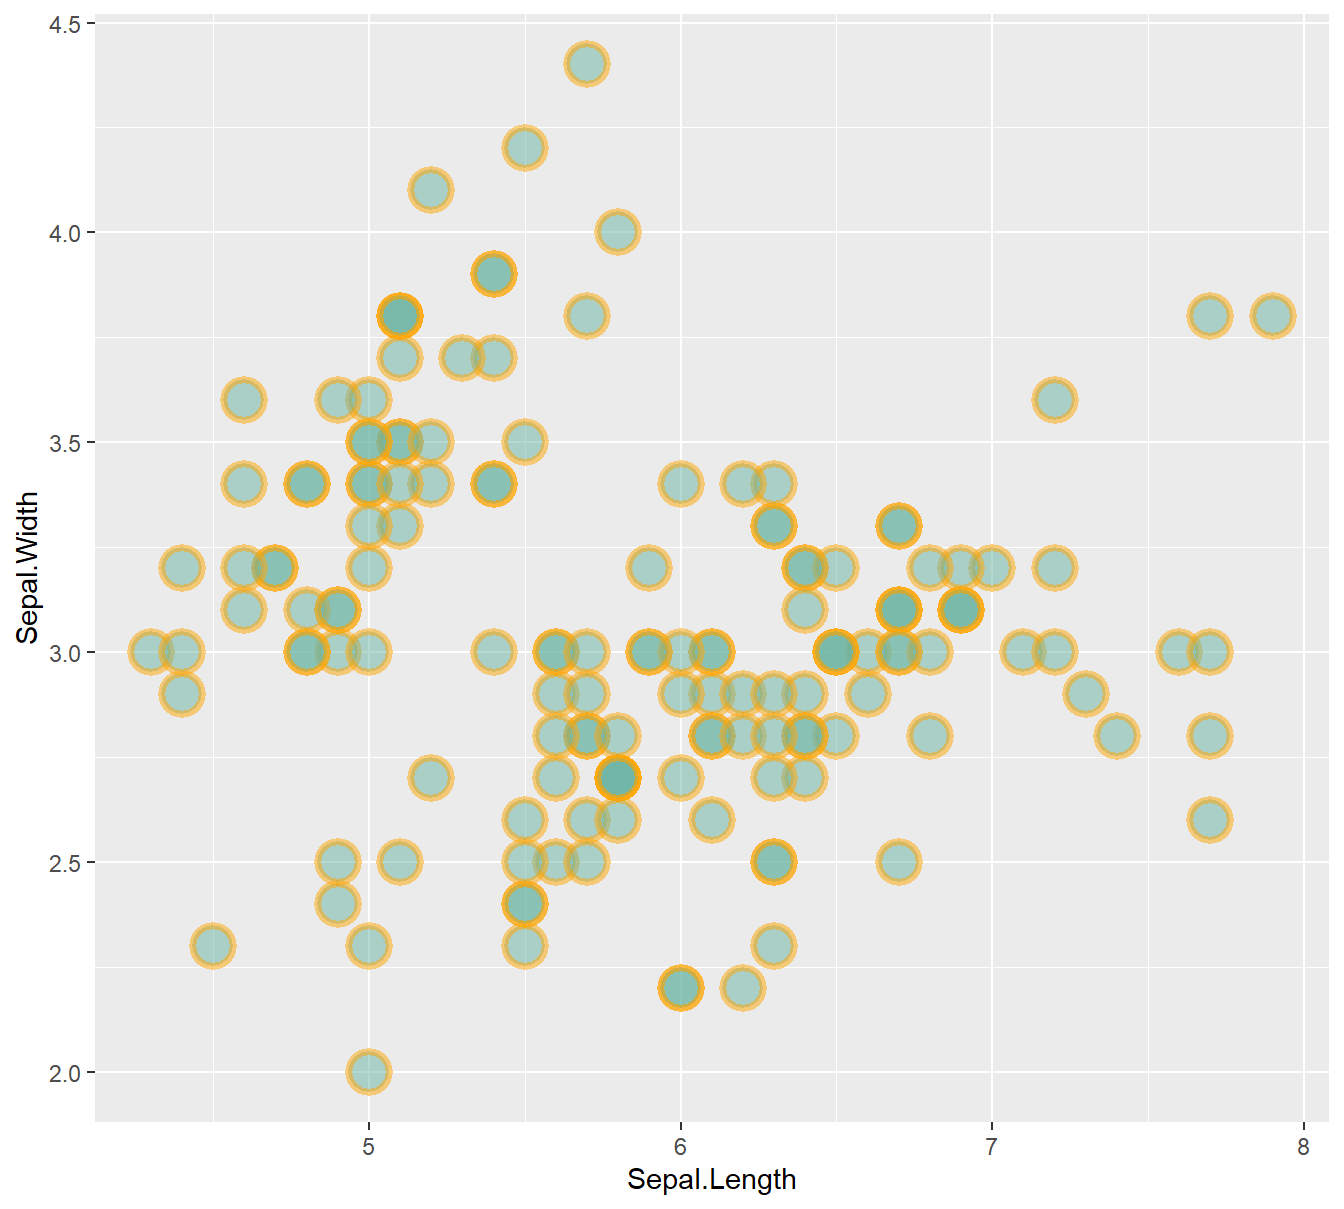
- color: the stroke color, the circle outline
- stroke: the stroke width
- fill: color of the circle inner part
- shape: shape of the marker. See list in the ggplot2 section
- alpha: circle transparency, [0->1], 0 is fully transparent
- color: the stroke color, the circle outline
- size: circle size
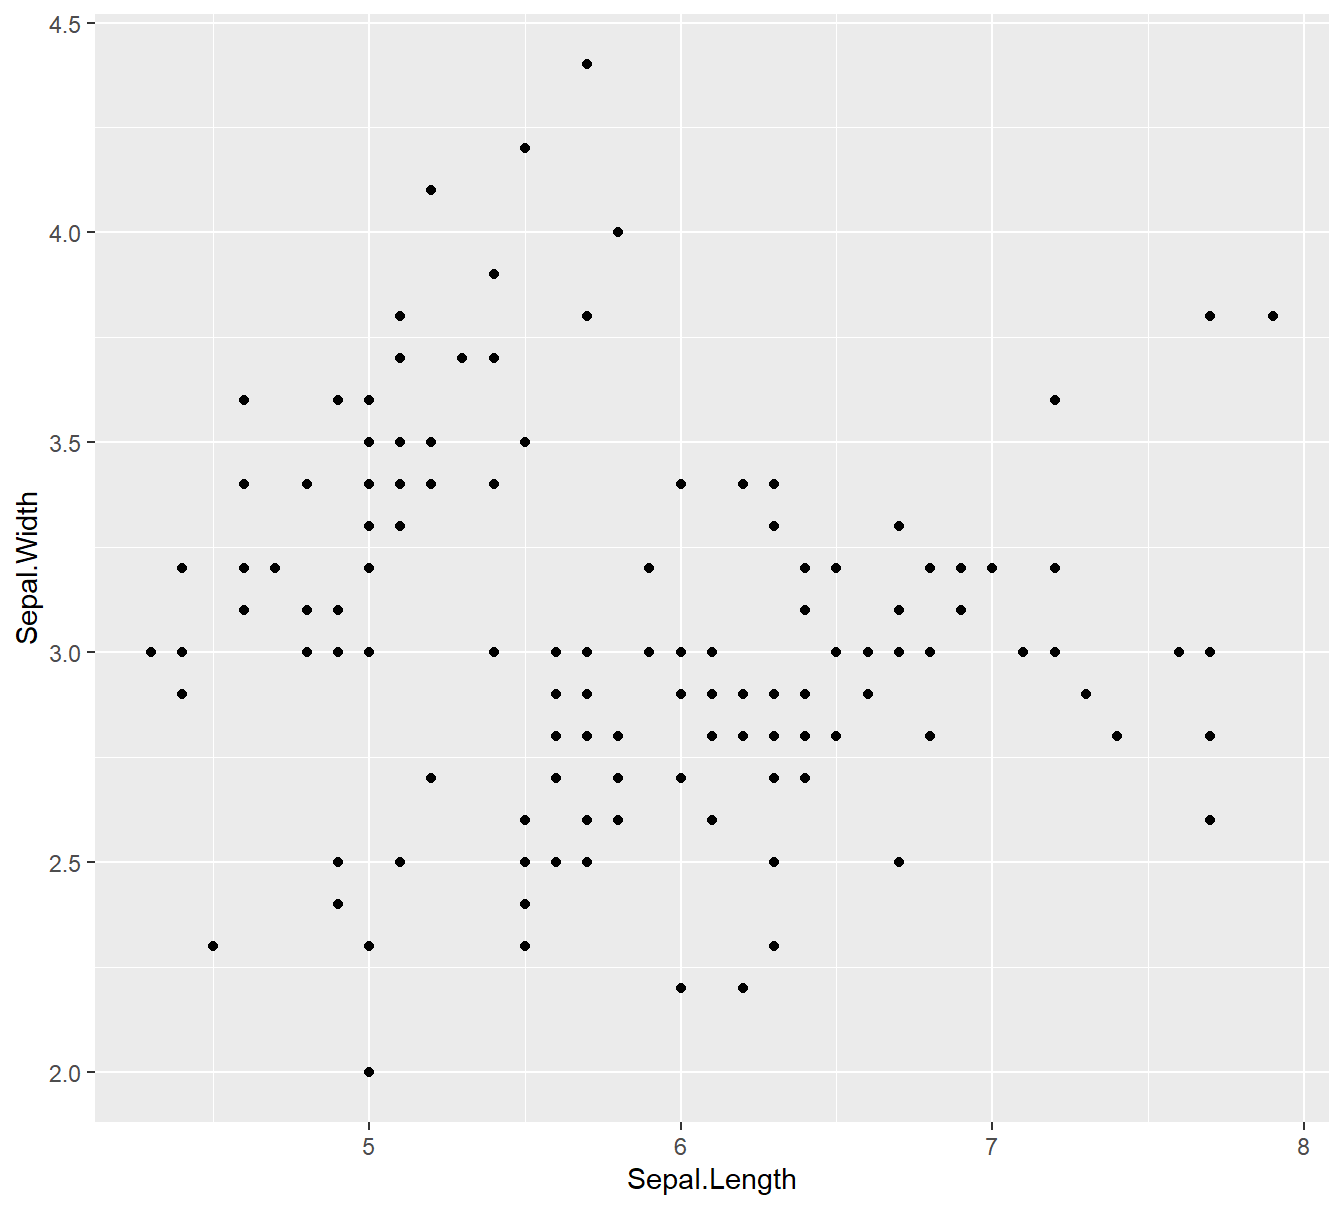
ggplot(iris, aes(x=Sepal.Length, y=Sepal.Width)) +
    geom_point(
        color="orange",
        fill="#69b3a2",
        shape=21,
        alpha=0.5,
        size=6,
        stroke = 2
        )
# theme_ipsum()
ggplot(iris, aes(x=Sepal.Length, y=Sepal.Width)) +
    geom_point(
        color="black",
        fill="#69b3a2",
        shape=22,
        alpha=0.5,
        size=6,
        stroke = 1
        ) +
    theme_ipsum()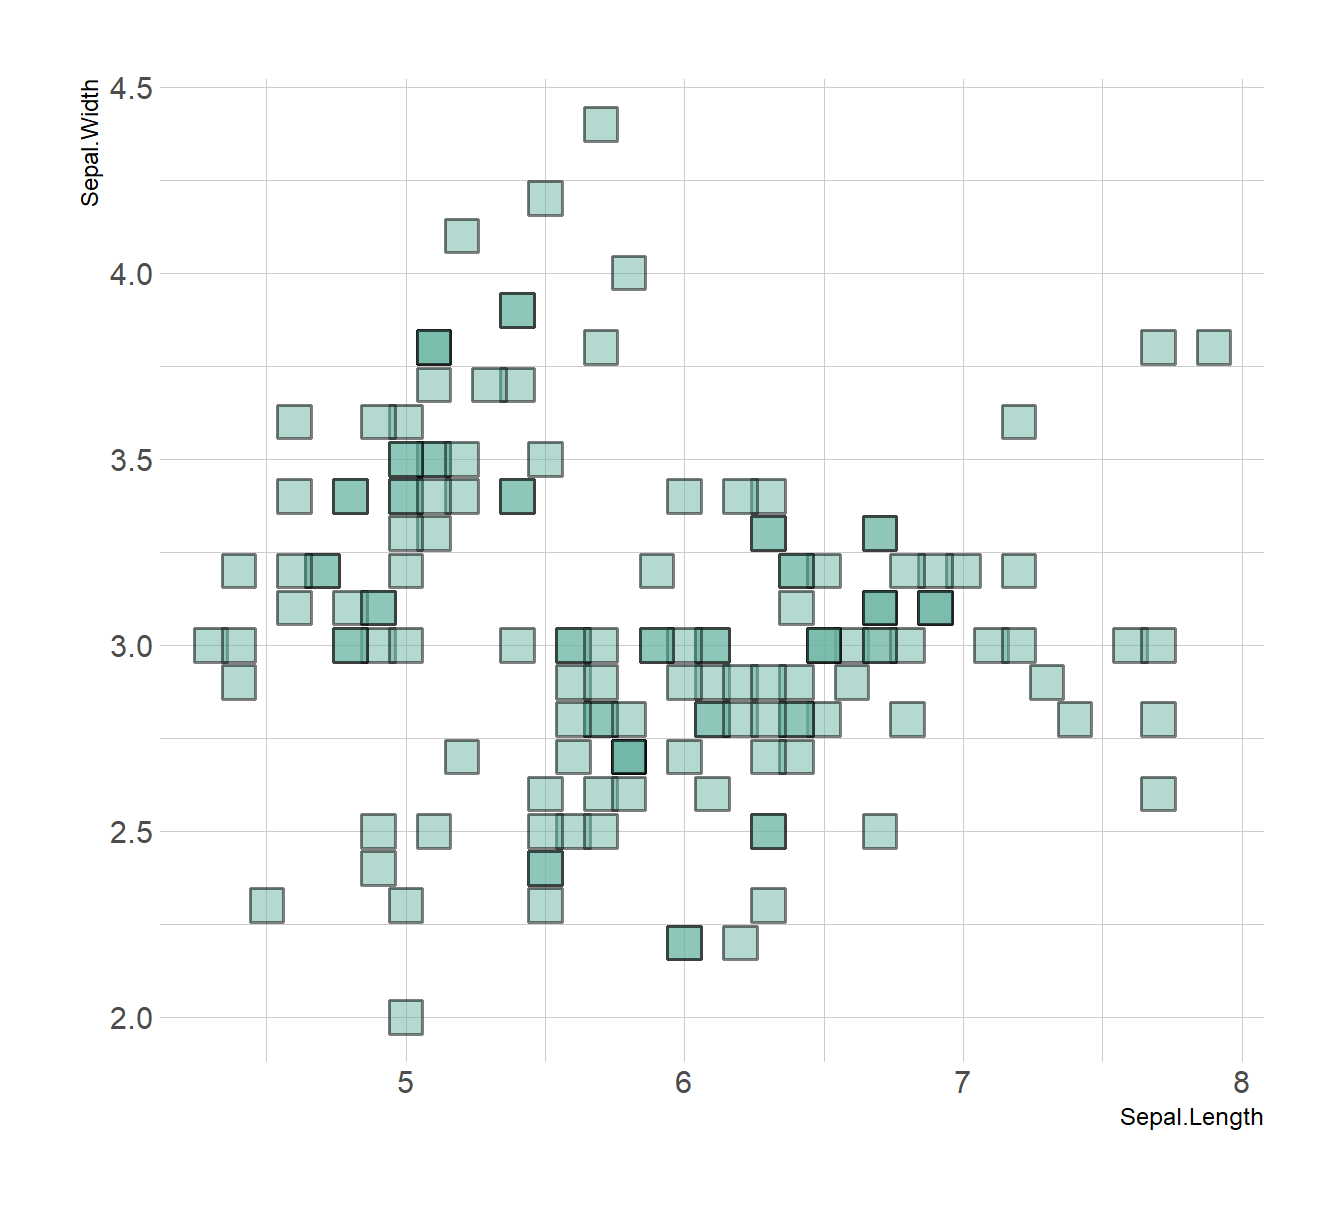
6.2 分组散点图
# A basic scatterplot with color depending on Species
ggplot(iris, aes(x=Sepal.Length, y=Sepal.Width, color=Species)) +
    geom_point(size=6) +
    theme_ipsum()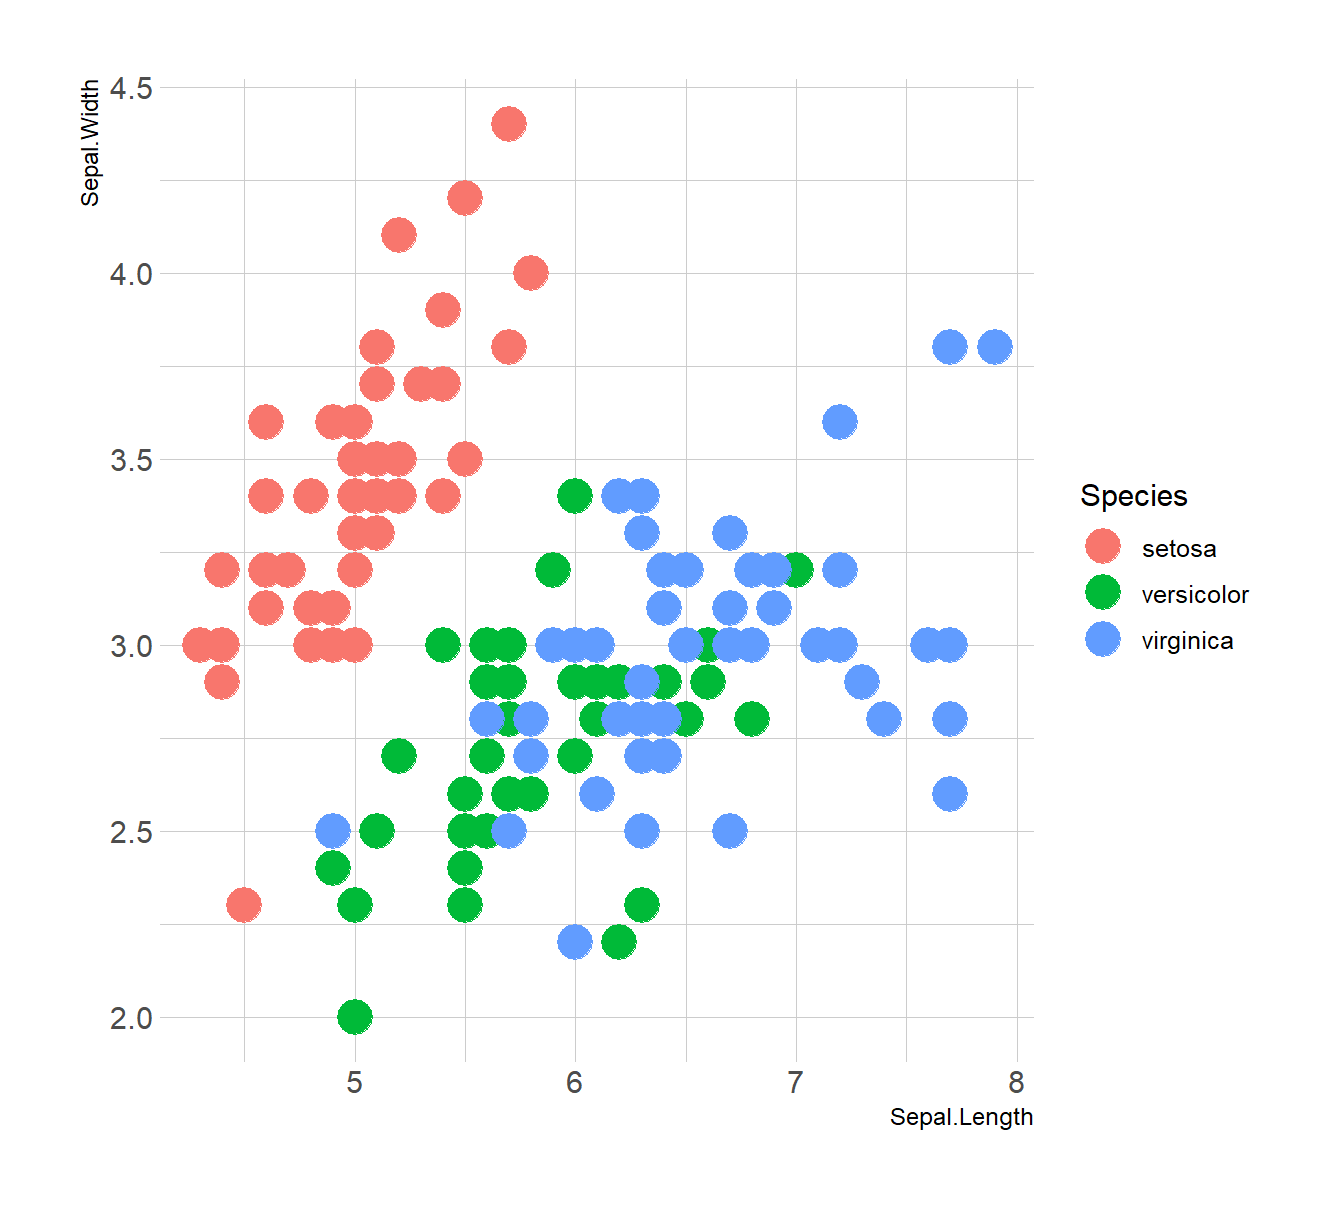
6.2.1 自定义样式
# Transparency
ggplot(iris, aes(x=Sepal.Length, y=Sepal.Width, alpha=Species)) +
    geom_point(size=6, color="#69b3a2") +
    theme_ipsum()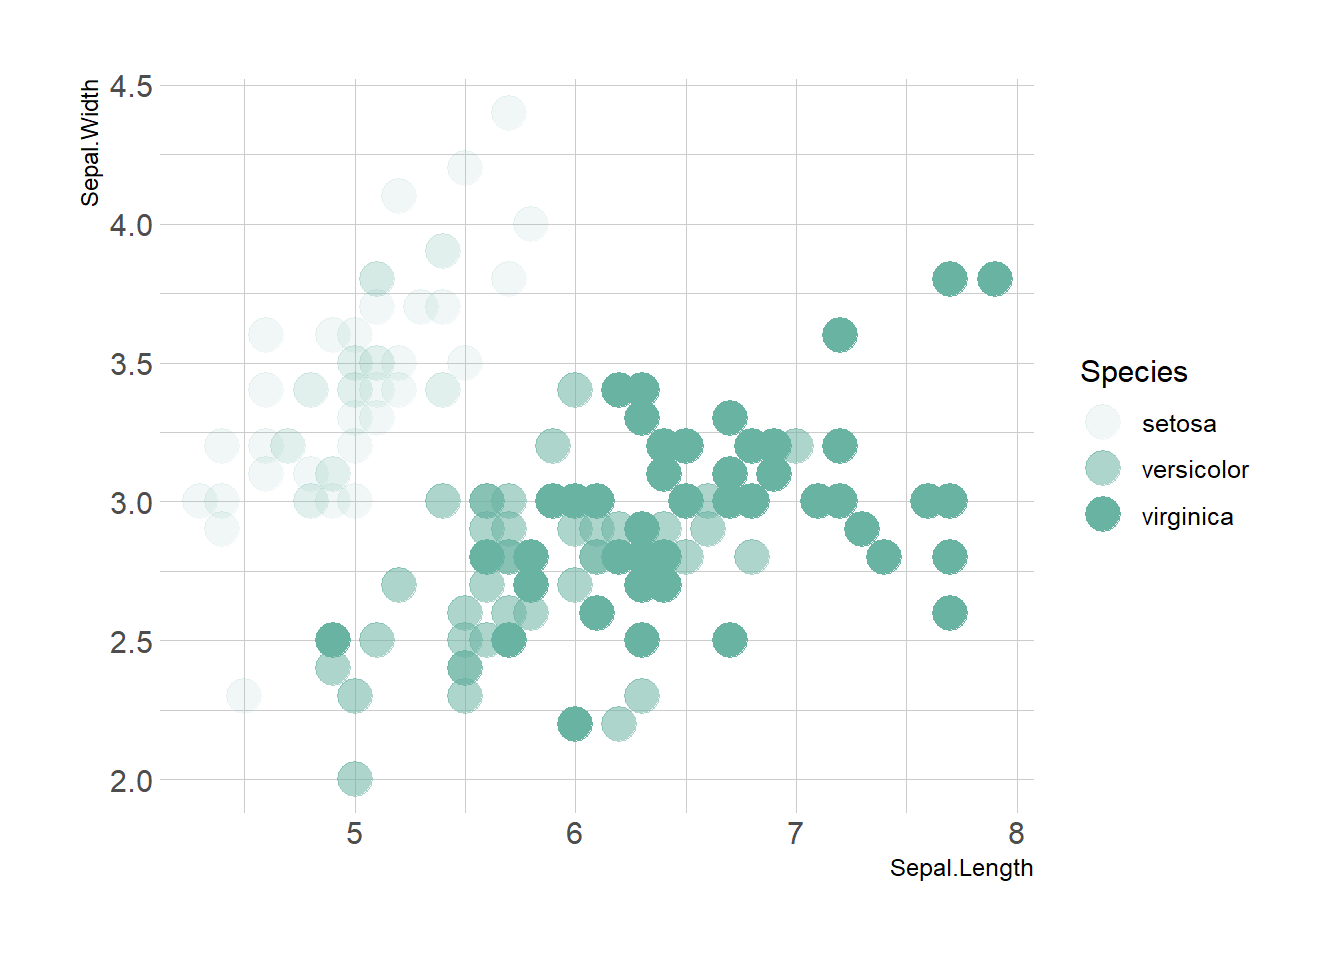
# Shape
ggplot(iris, aes(x=Sepal.Length, y=Sepal.Width, shape=Species)) +
    geom_point(size=6) +
    theme_ipsum()
# Size
ggplot(iris, aes(x=Sepal.Length, y=Sepal.Width, shape=Species)) +
    geom_point(size=6) +
    theme_ipsum()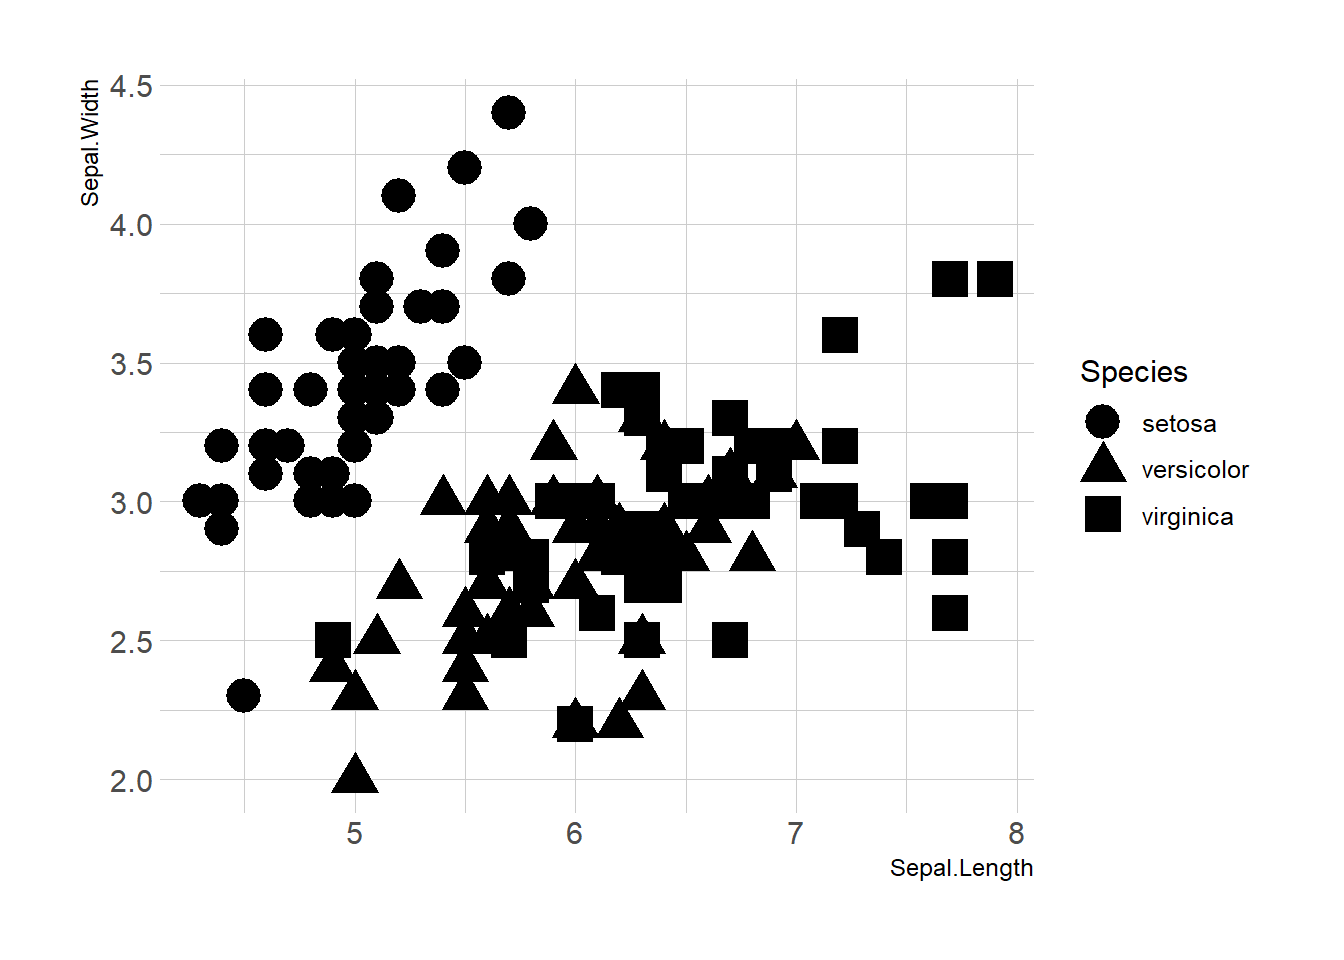
# A basic scatterplot with color depending on Species
ggplot(iris, aes(x=Sepal.Length, y=Sepal.Width, shape=Species, alpha=Species, size=Species, color=Species)) +
    geom_point() +
    theme_ipsum()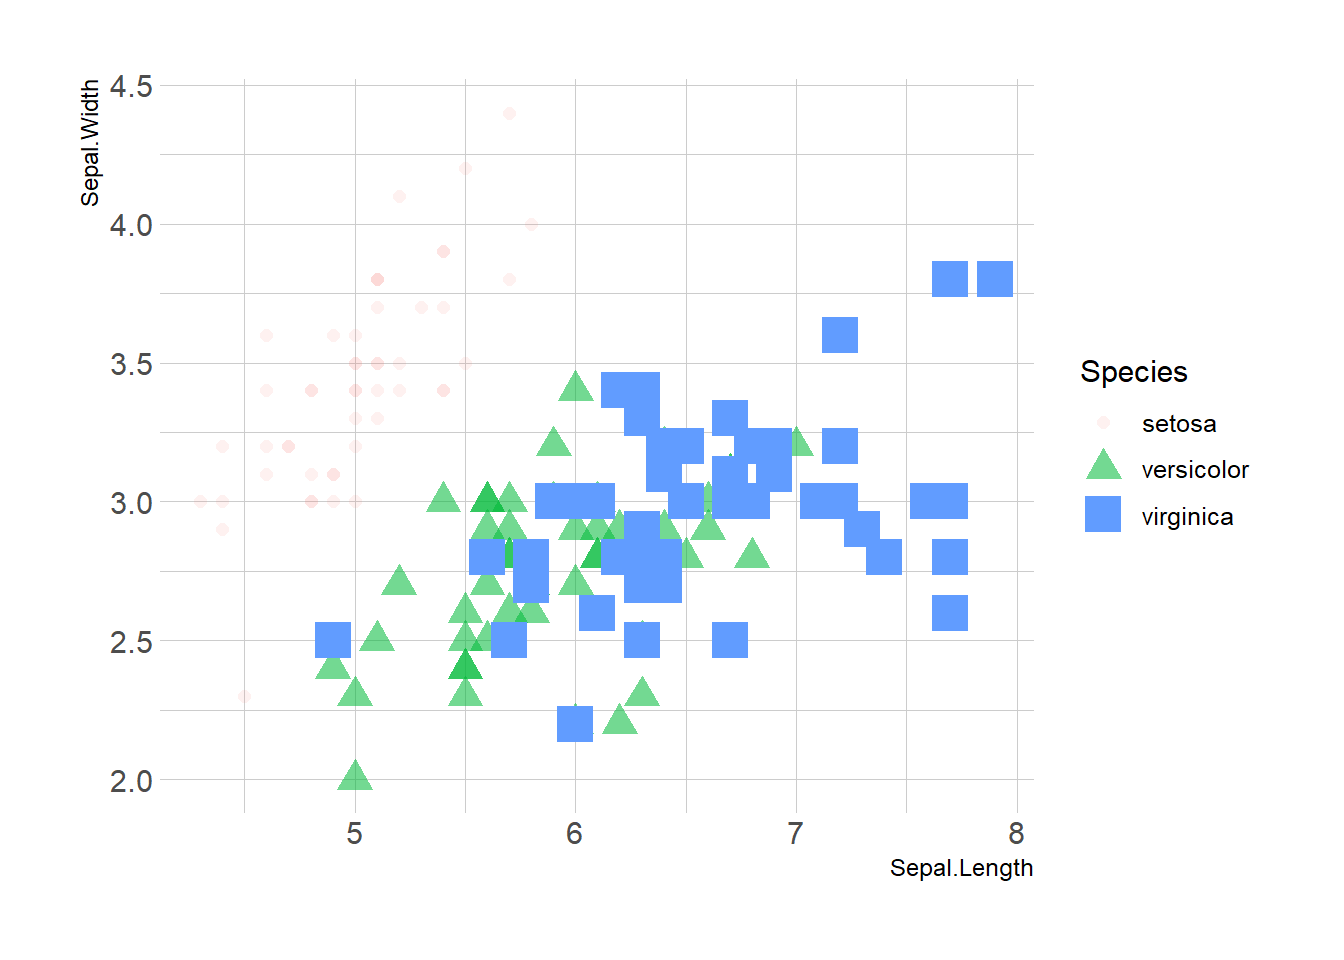
## add rug 添加边际rug
ggplot(data=iris, aes(x=Sepal.Length, Petal.Length)) +
  geom_point() +
  geom_rug(col="steelblue",alpha=0.1, size=1.5)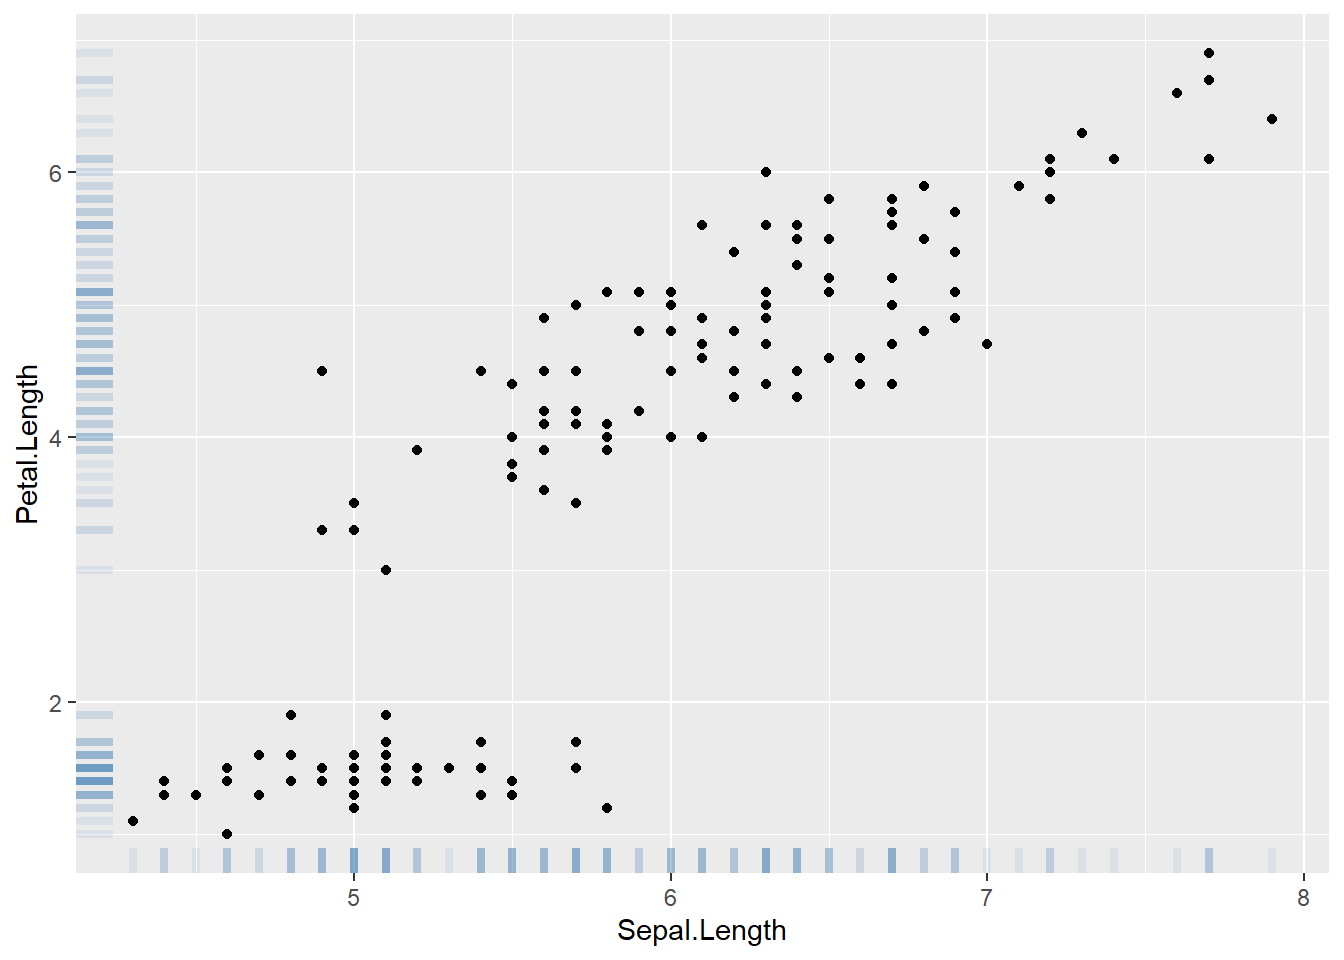
6.3 带label散点图
data <- head(mtcars, 30)

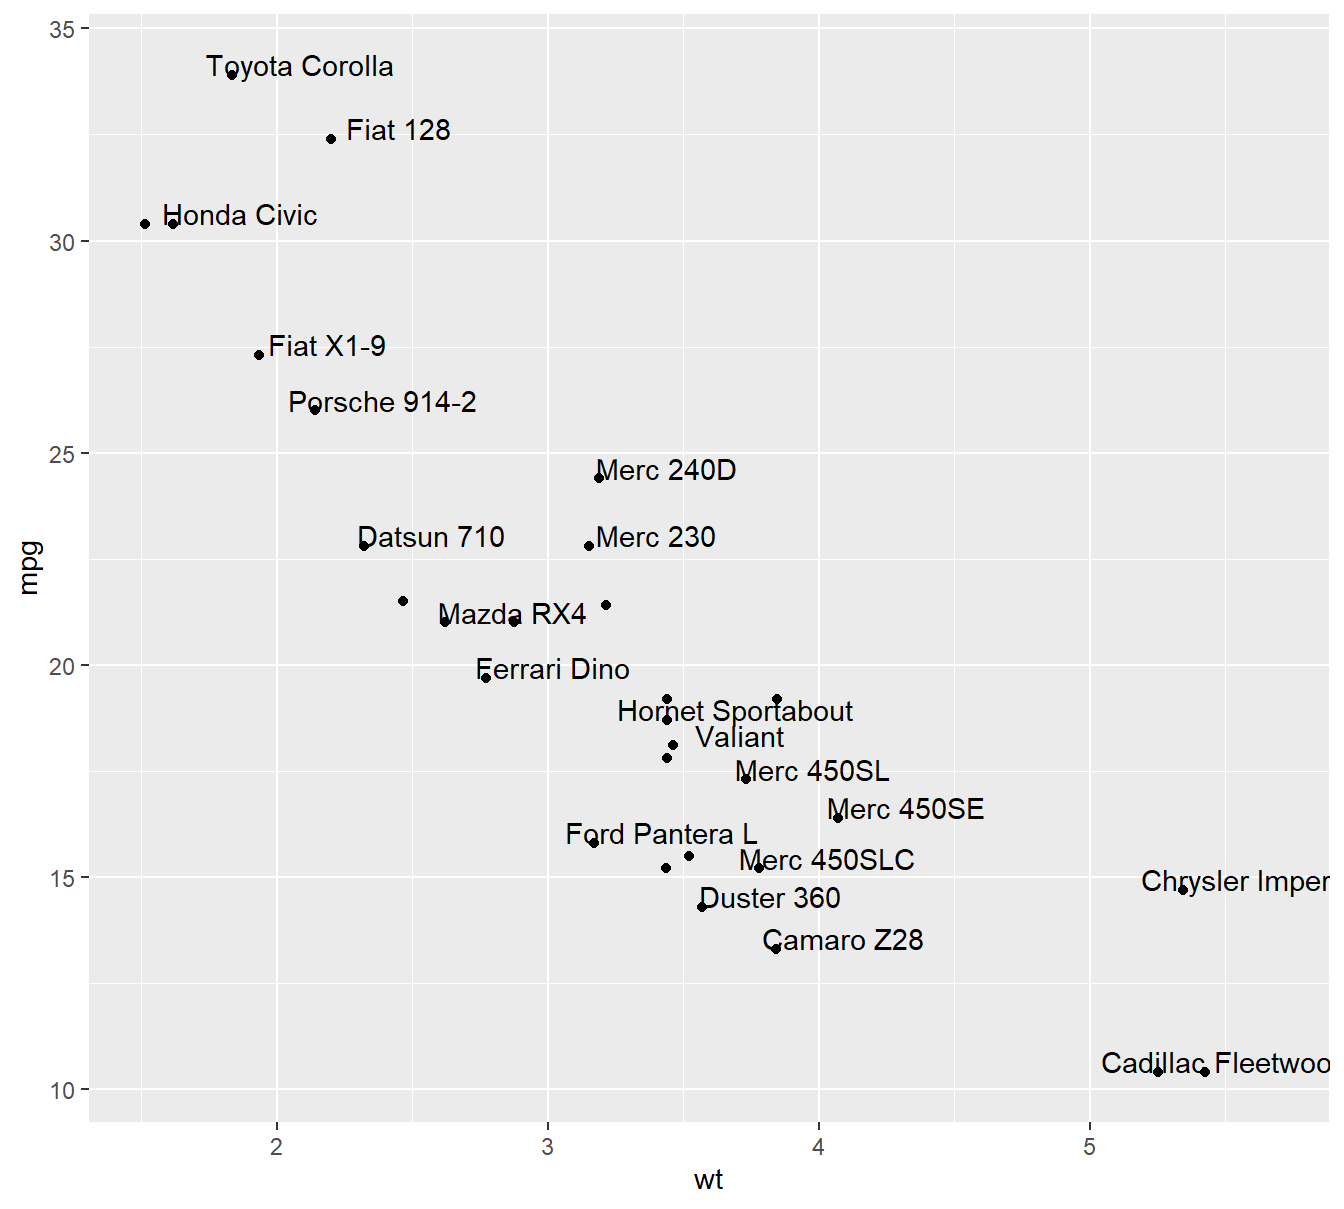
# 1/ add text with geom_text, use nudge to nudge the text
ggplot(data, aes(x=wt, y=mpg)) +
  geom_point() + # Show dots
  geom_text(
    label=rownames(data),
    nudge_x = 0.25, nudge_y = 0.25,
    check_overlap = T
  )
6.3.1 显示指定label
data <- head(mtcars, 30)

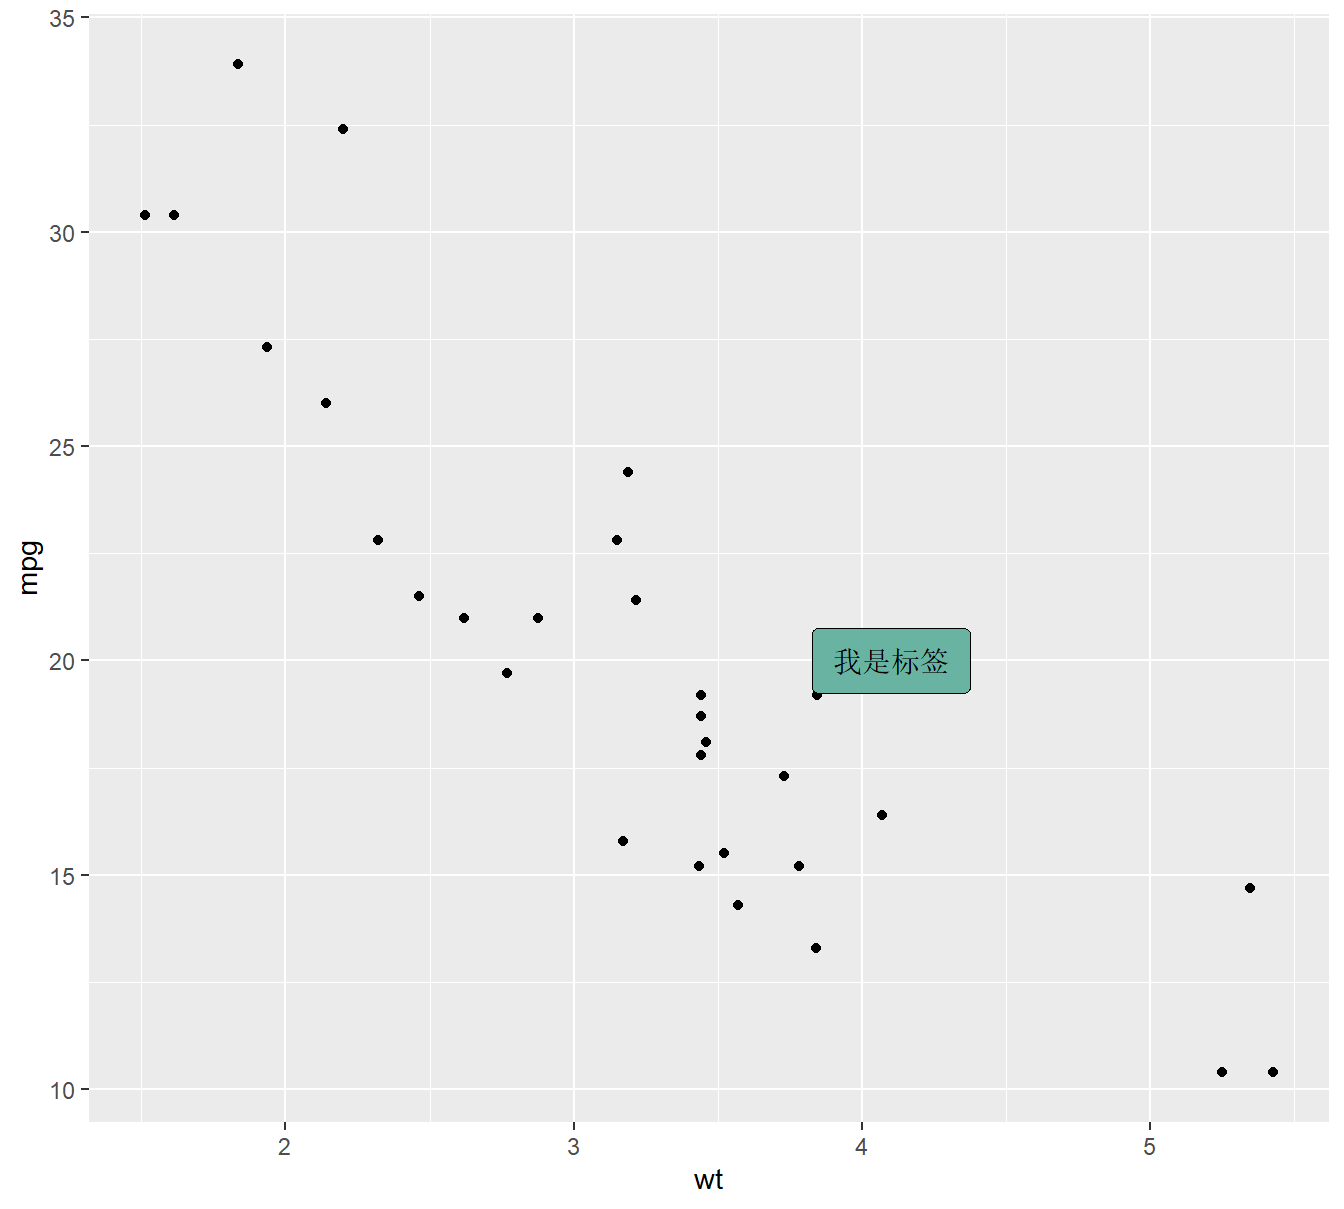
# Add one annotation
ggplot(data, aes(x=wt, y=mpg)) +
  geom_point() + # Show dots
  geom_label(
    label="我是标签",
    x=4.1,
    y=20,
    label.padding = unit(0.55, "lines"), # Rectangle size around label
    label.size = 0.35,
    color = "black",
    fill="#69b3a2"
  )
# Change data rownames as a real column called 'carName'
data <- data %>%
  rownames_to_column(var="carName")

# Plot
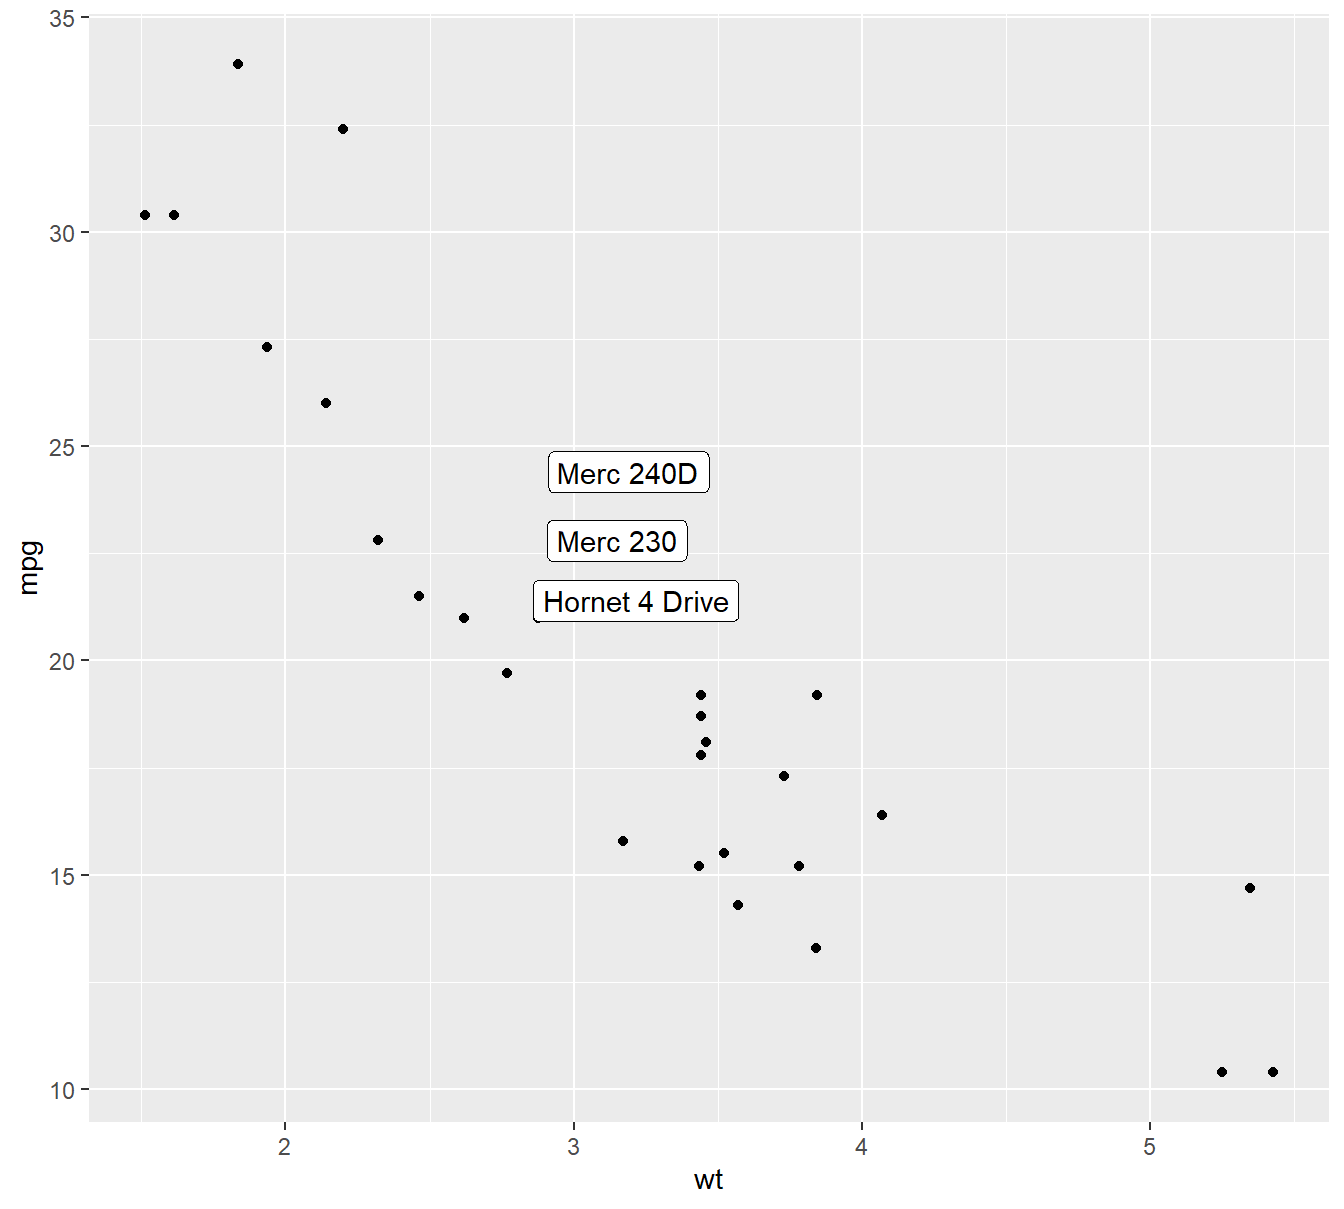
ggplot(data, aes(x=wt, y=mpg)) +
  geom_point() +
  geom_label(
    data=data %>% filter(mpg>20 & wt>3), # Filter data first
    aes(label=carName)
  )
6.4 气泡图
library(gapminder)
data <- gapminder %>% filter(year=="2007") %>% dplyr::select(-year)

# Most basic bubble plot
data %>%
  arrange(desc(pop)) %>%
  mutate(country = factor(country, country)) %>%
  ggplot(aes(x=gdpPercap, y=lifeExp, size=pop, color=continent)) +
    geom_point(alpha=0.5) +
    scale_size(range = c(.1, 24), name="Population (M)")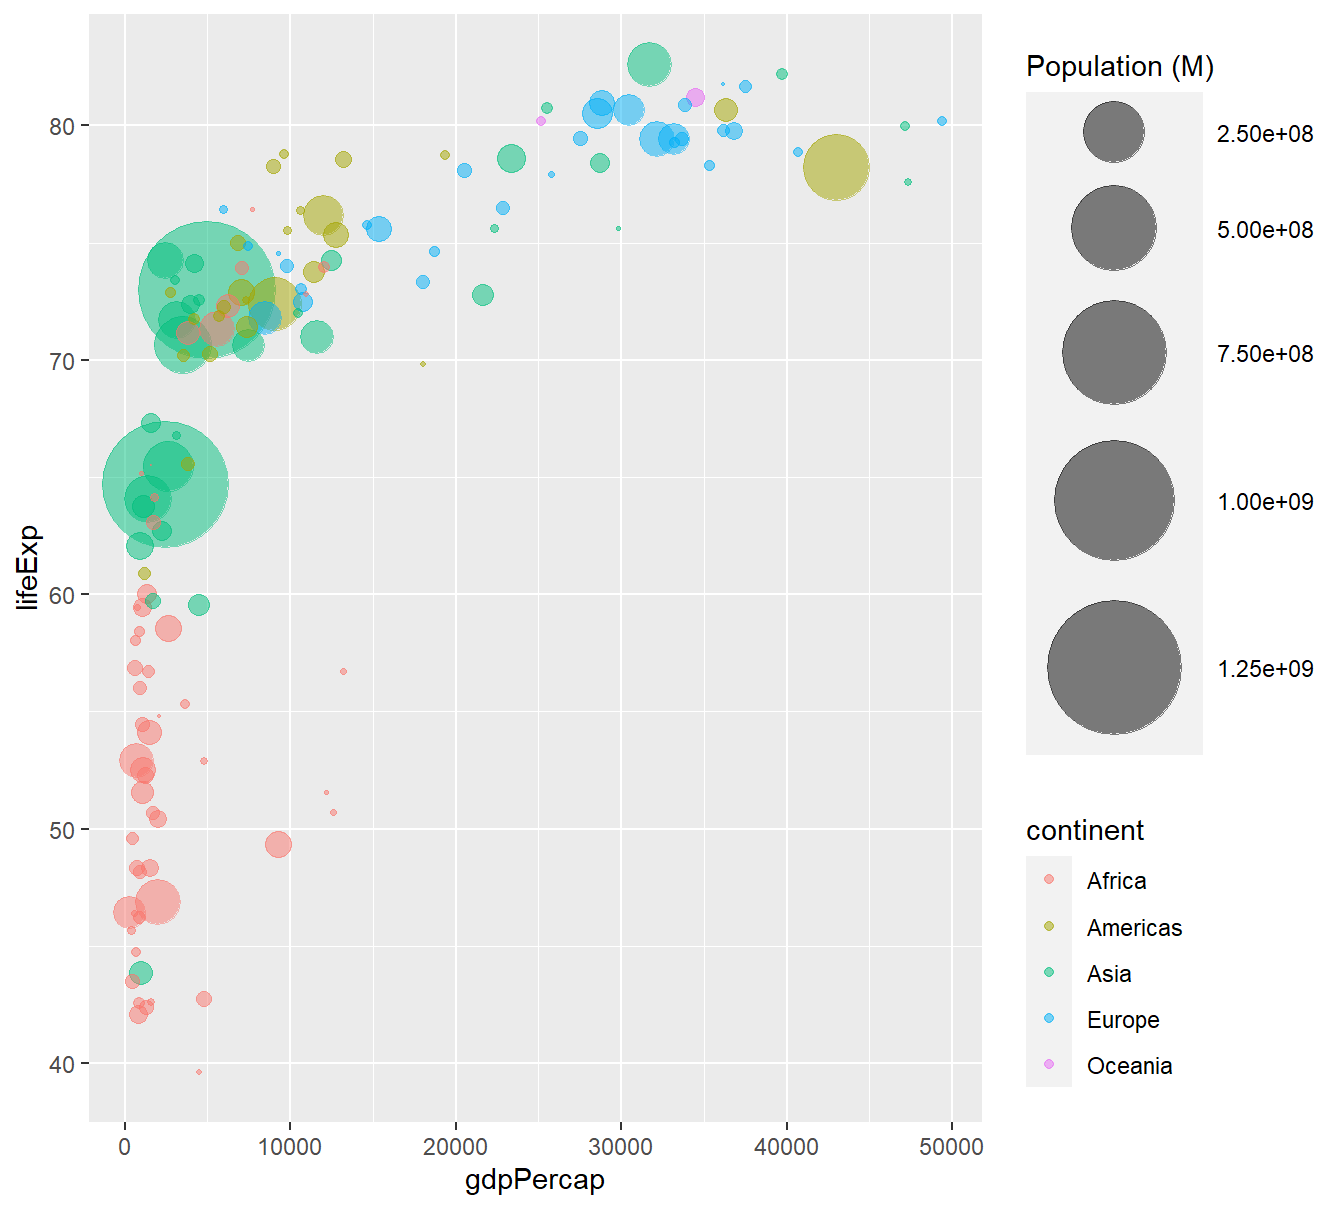
## 样式调整
data %>%
  arrange(desc(pop)) %>%
  mutate(country = factor(country, country)) %>%
  ggplot(aes(x=gdpPercap, y=lifeExp, size=pop, fill=continent)) +
    geom_point(alpha=0.5, shape=21, color="black") +
    scale_size(range = c(.1, 24), name="Population (M)") +
    scale_fill_viridis(discrete=TRUE, guide=FALSE, option="A") +
    theme_ipsum() +
    theme(legend.position="bottom") +
    ylab("Life Expectancy") +
    xlab("Gdp per Capita") +
    theme(legend.position = "none")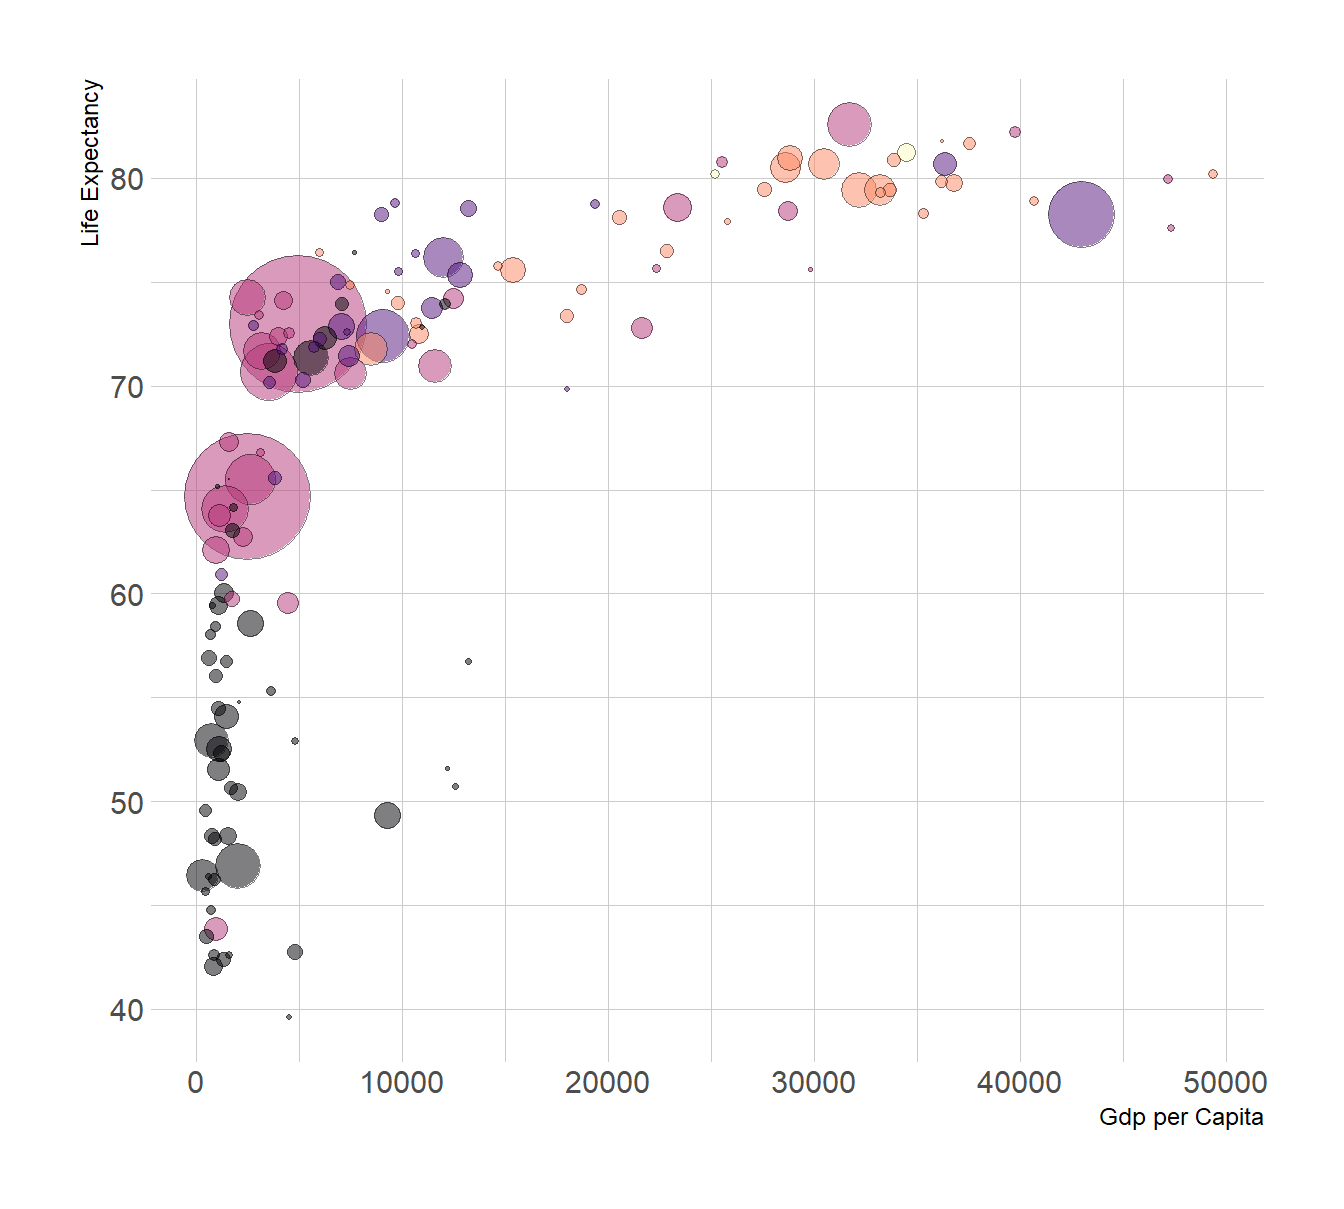
6.5 线性拟合
data <- data.frame(
  cond = rep(c("condition_1", "condition_2"), each=10),
  my_x = 1:100 + rnorm(100,sd=9),
  my_y = 1:100 + rnorm(100,sd=16)
)

# Basic scatter plot.
p1 <- ggplot(data, aes(x=my_x, y=my_y)) +
  geom_point( color="#69b3a2") +
  theme_ipsum()

# with linear trend
p2 <- ggplot(data, aes(x=my_x, y=my_y)) +
  geom_point() +
  geom_smooth(method=lm , color="red", se=FALSE) +
  theme_ipsum()

# linear trend + confidence interval
p3 <- ggplot(data, aes(x=my_x, y=my_y)) +
  geom_point() +
  geom_smooth(method=lm , color="red", fill="#69b3a2", se=TRUE) +
  theme_ipsum()
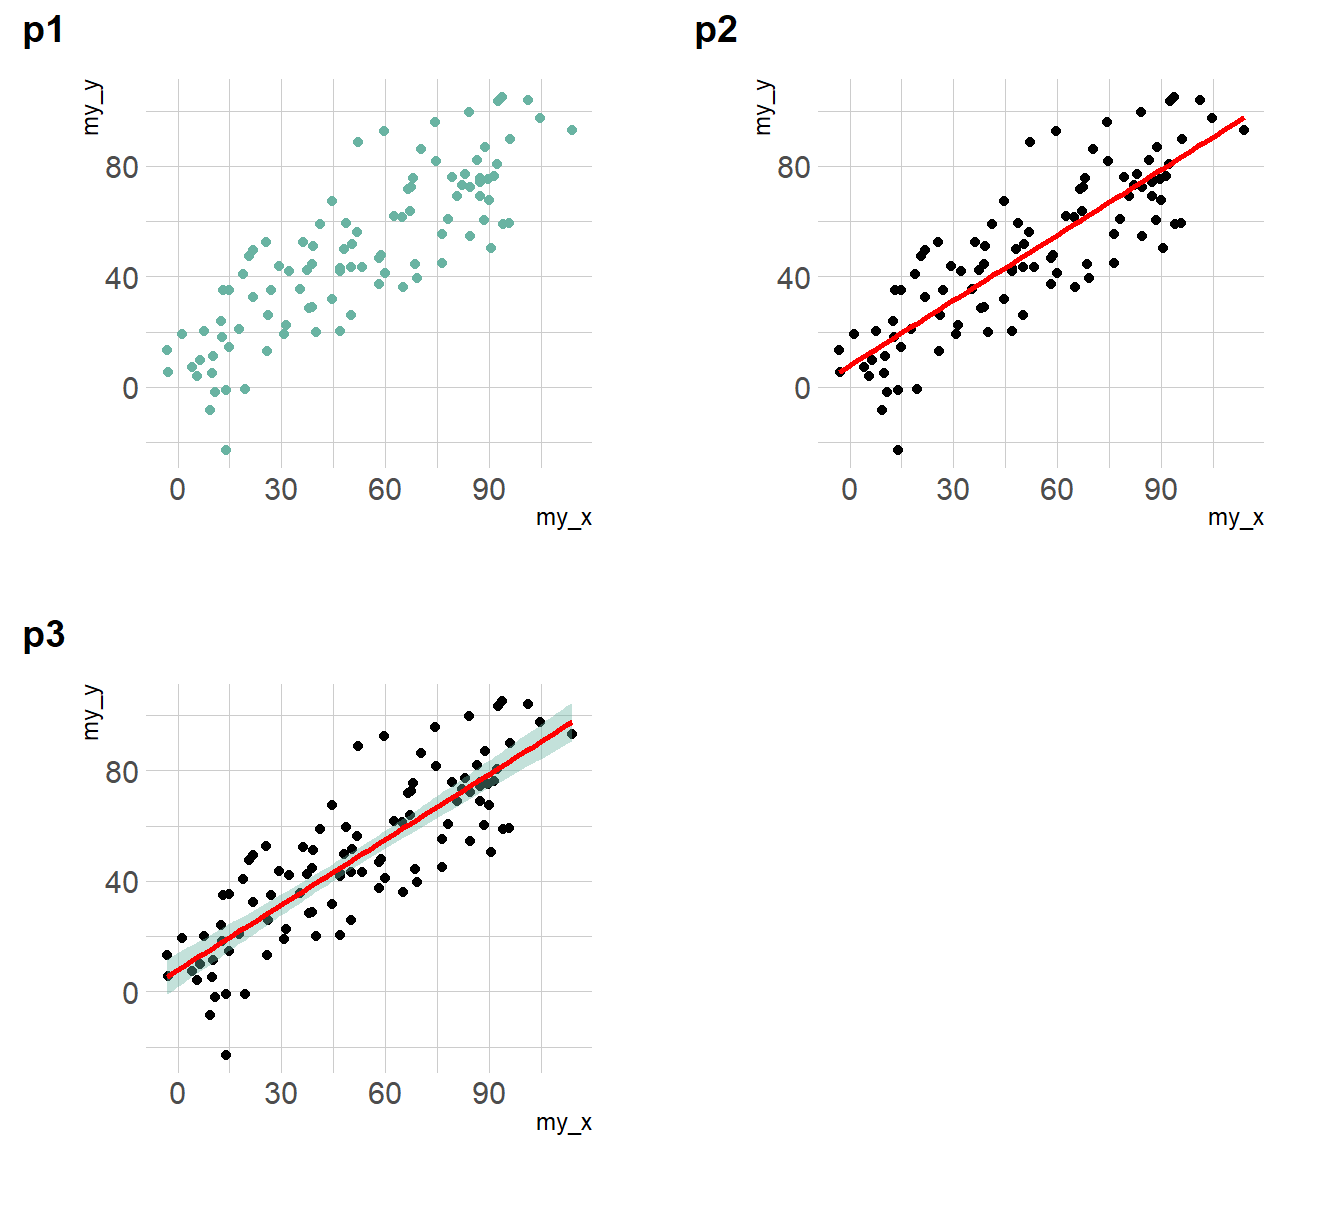
ggarrange(p1,p2,p3,labels = c("p1","p2","p3"))