第 12 章 河流图
12.1 基本河流图
library(ggstream)

#plot
ggplot(blockbusters, aes(x = year, y = box_office, fill = genre)) +
  geom_stream(type = "mirror")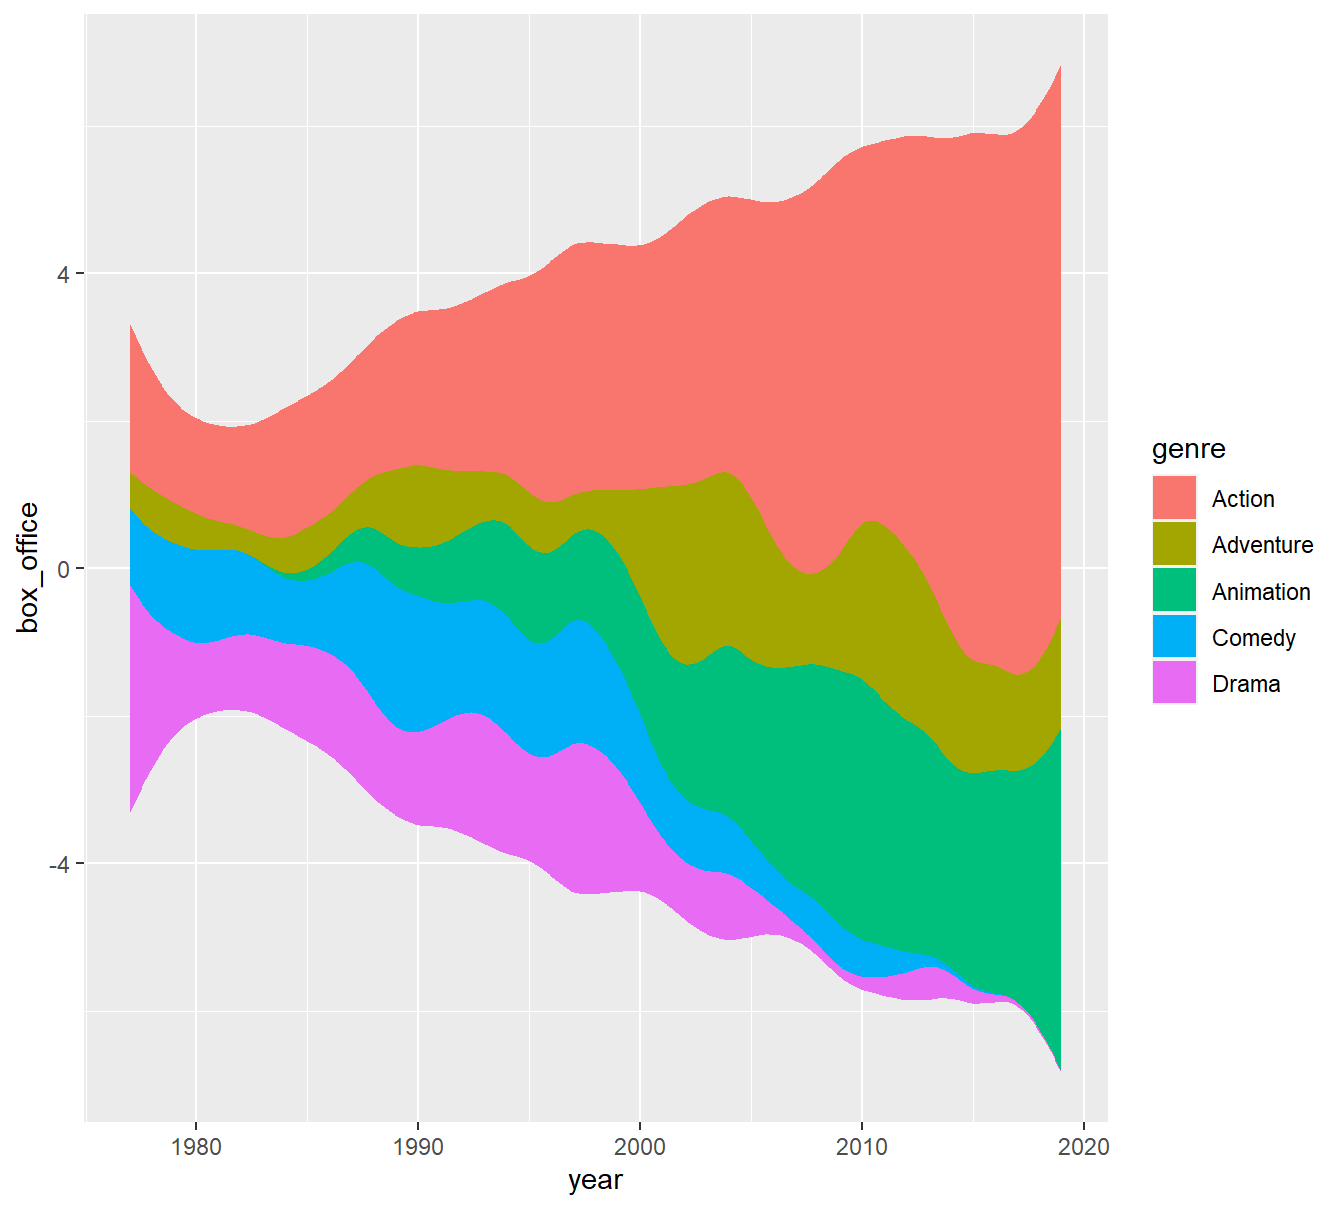
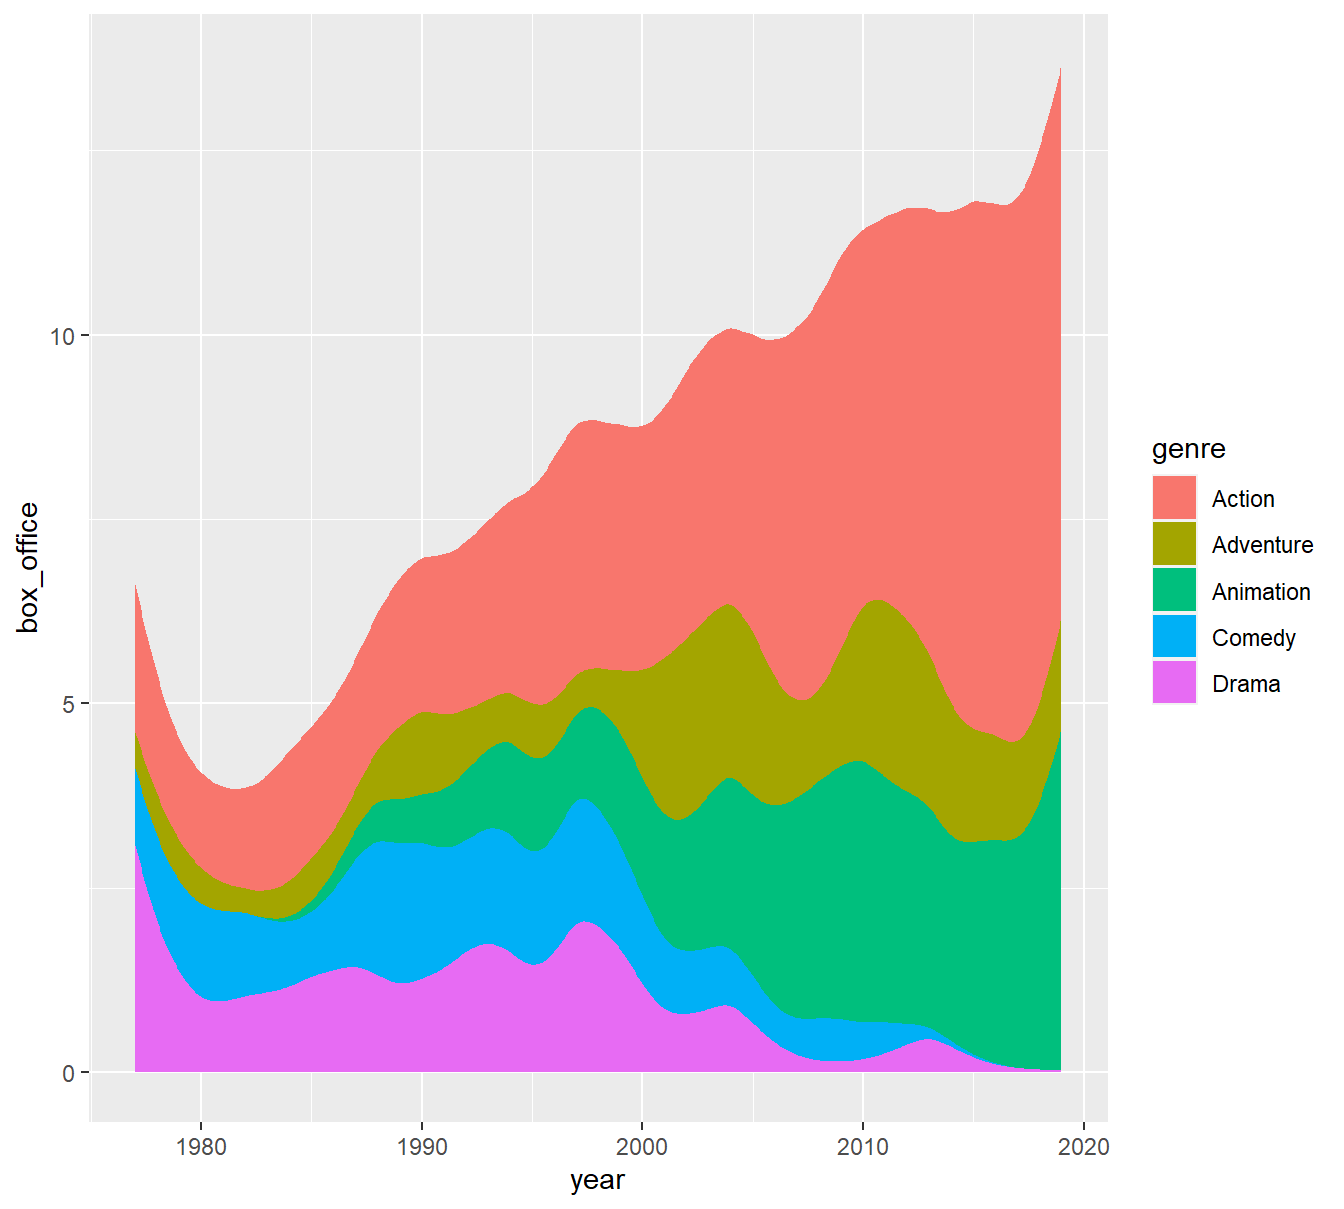
ggplot(blockbusters, aes(x = year, y = box_office, fill = genre)) +
  geom_stream(type = "proportional")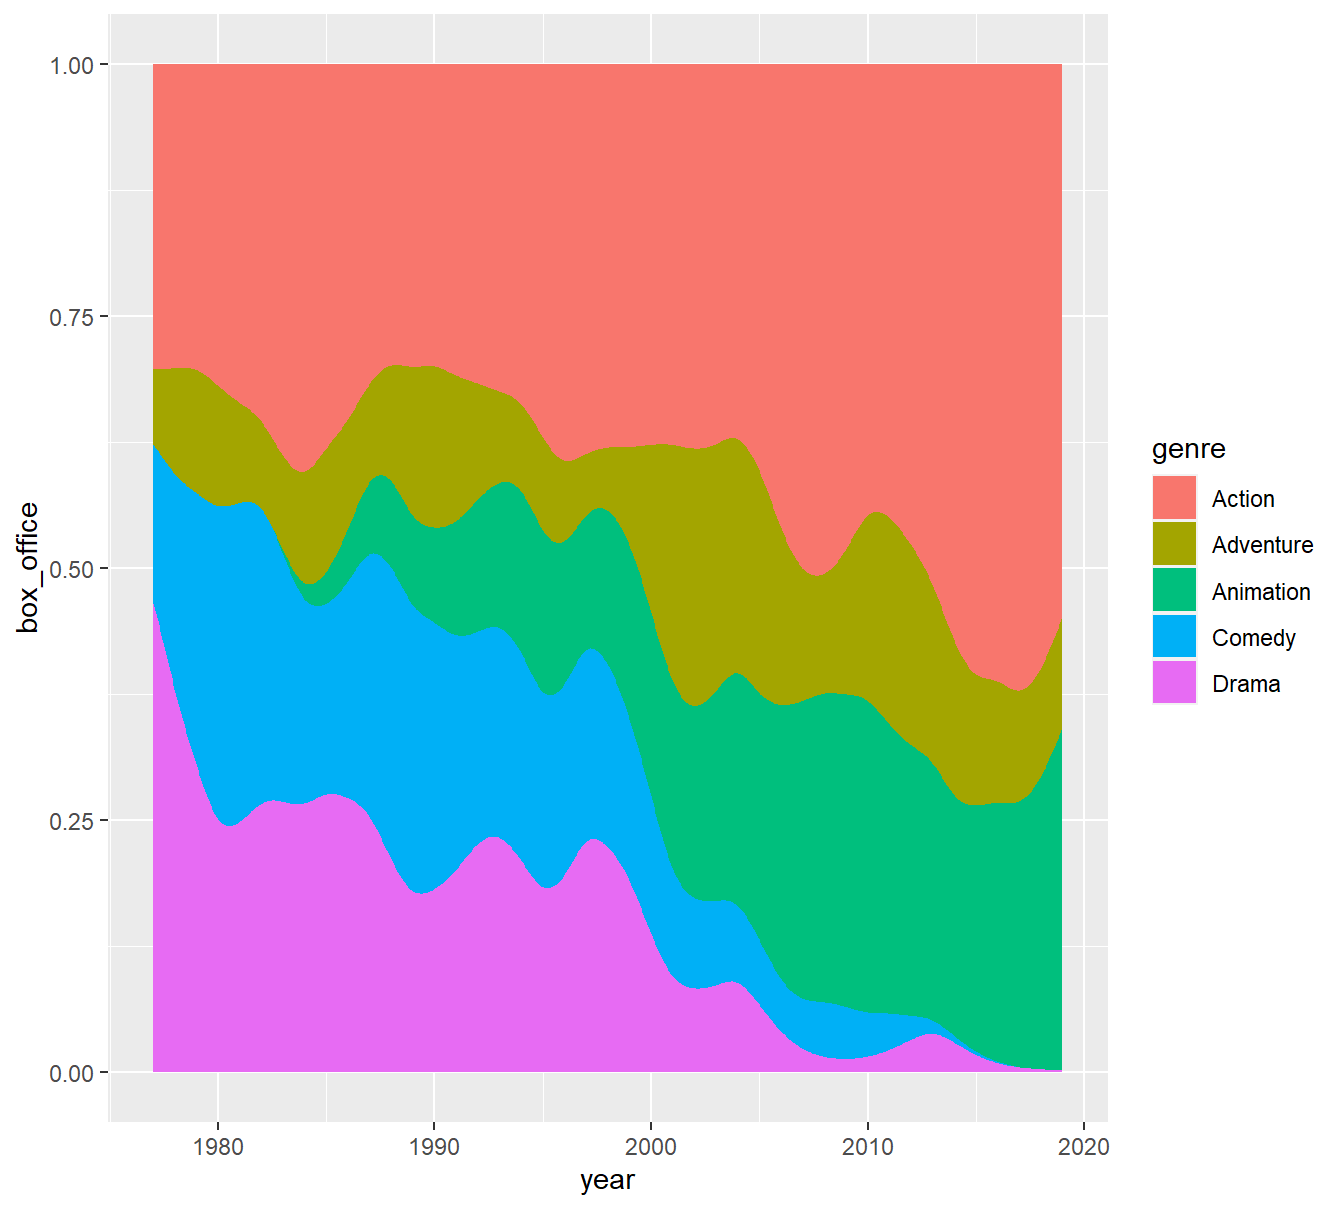
12.1.1 自定义样式
colors <- c("#6181BD4E","#F348004E","#64A10E4E","#9300264E","#464E044E")
ggplot(blockbusters, aes(x = year, y = box_office, fill = genre)) +
  geom_stream(type = "mirror") +
  scale_fill_manual(values = colors) +   # 配色
  geom_stream(color = "black", lwd = 0.25) +   # 边界
  geom_stream_label(aes(label = genre))+  # label
theme_minimal() 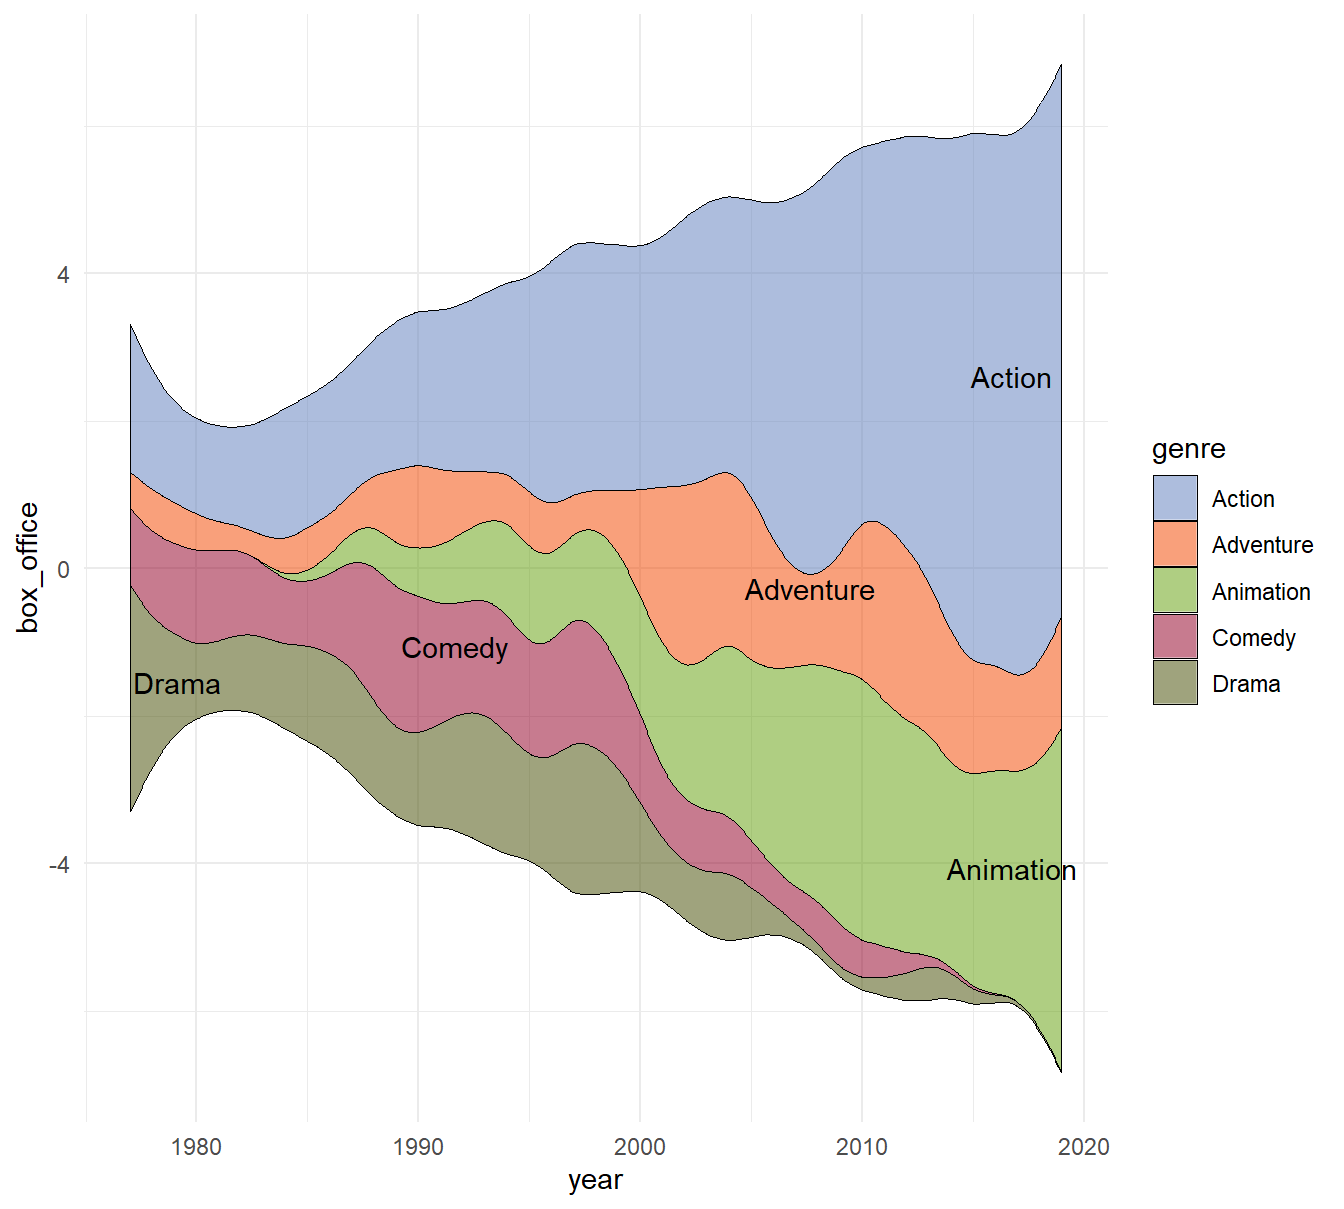
12.2 分组排序(sorting)
library(tidyverse)
set.seed(123)
df <- map_dfr(1:10, ~{
  x <- 1:sample(1:70, 1)
  tibble(x = x + sample(1:150, 1)) %>%
    mutate(y = sample(1:10, length(x), replace = T),
           k = .x %>% as.character())
})

p <- df %>%
  ggplot(aes(x, y, fill = k)) +
  theme_void() +
  theme(legend.position = "none")

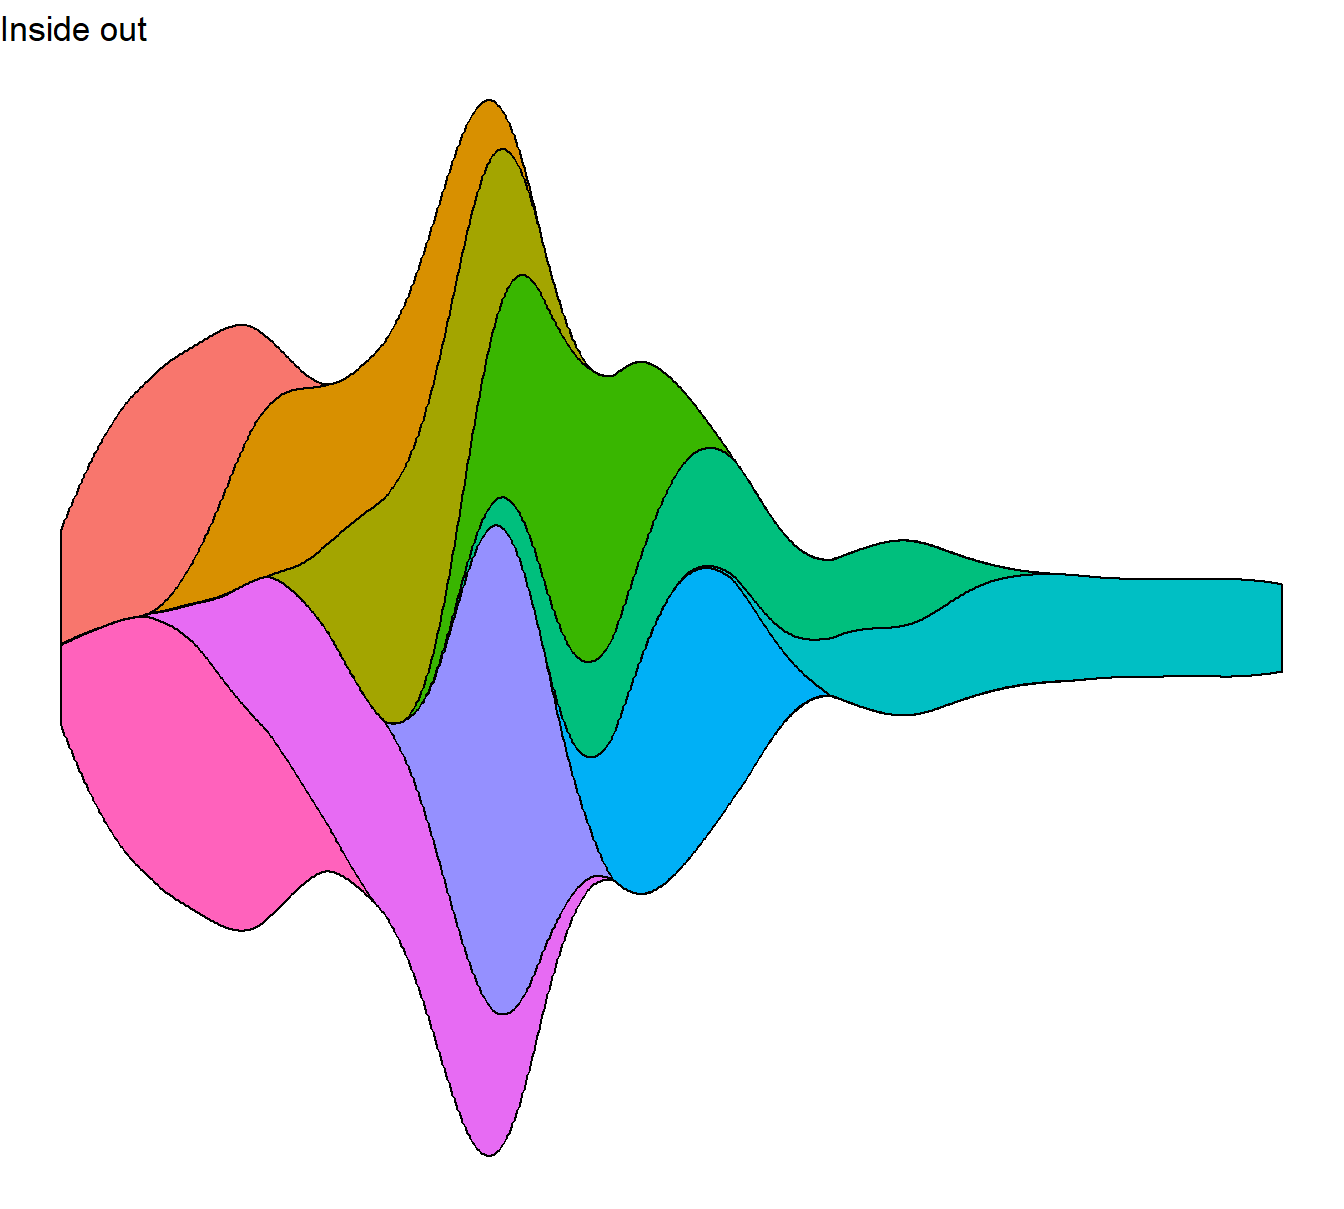
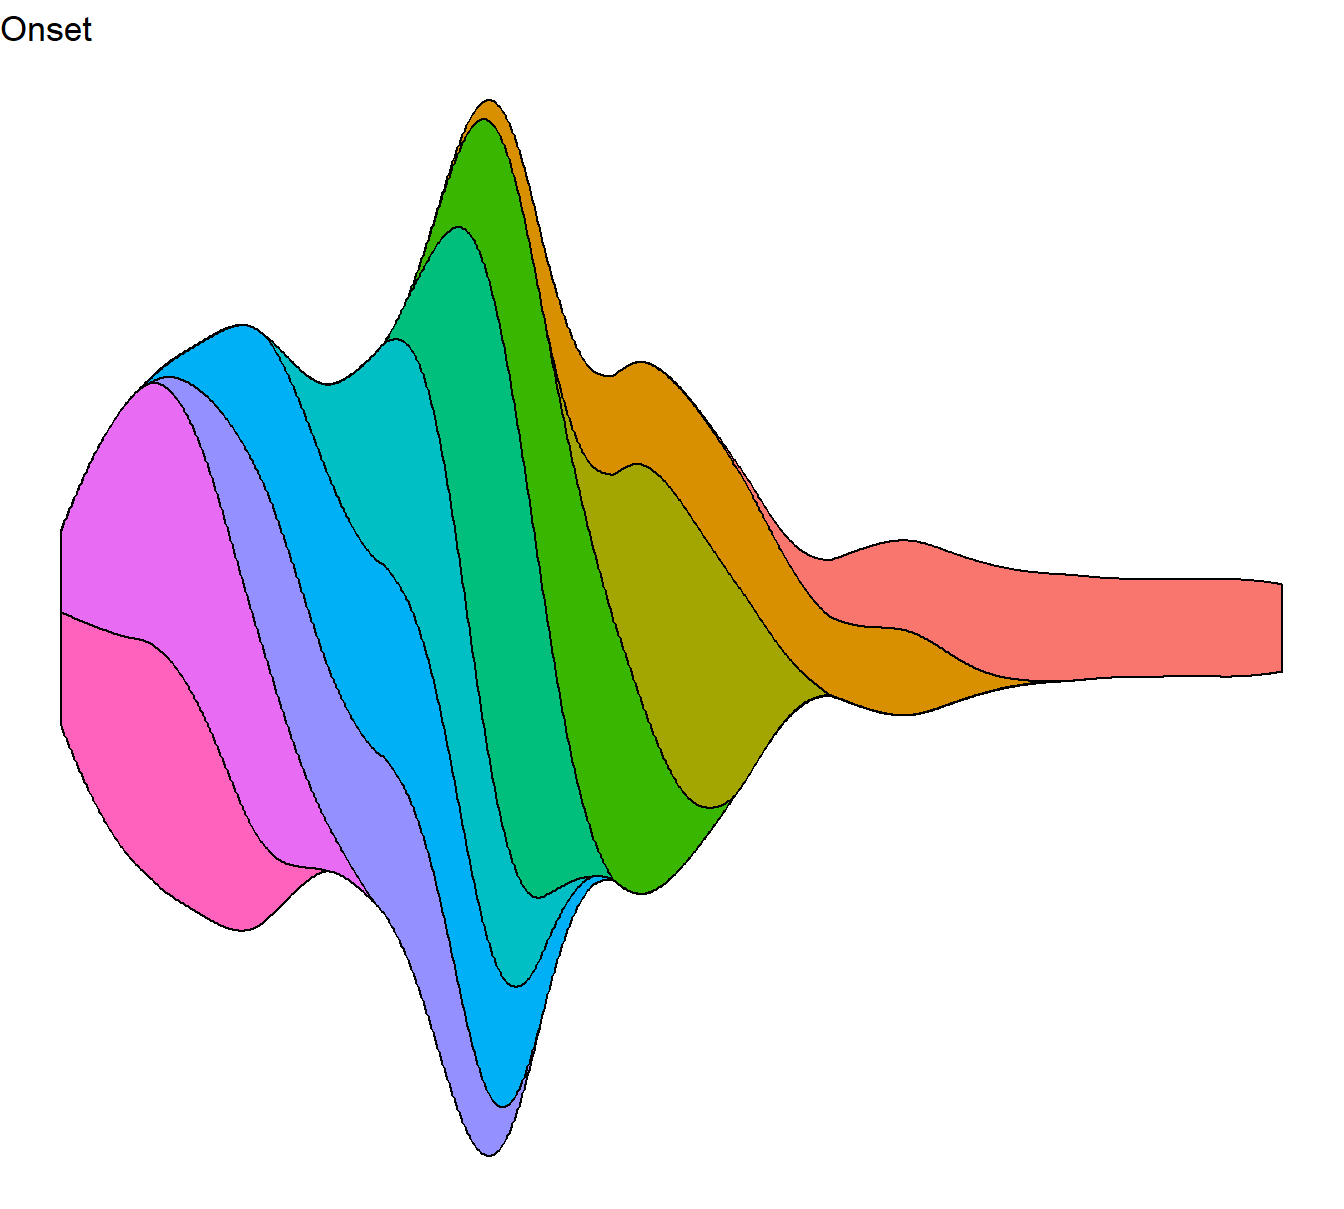
p + geom_stream(color = "black") +
  ggtitle("None (Default)")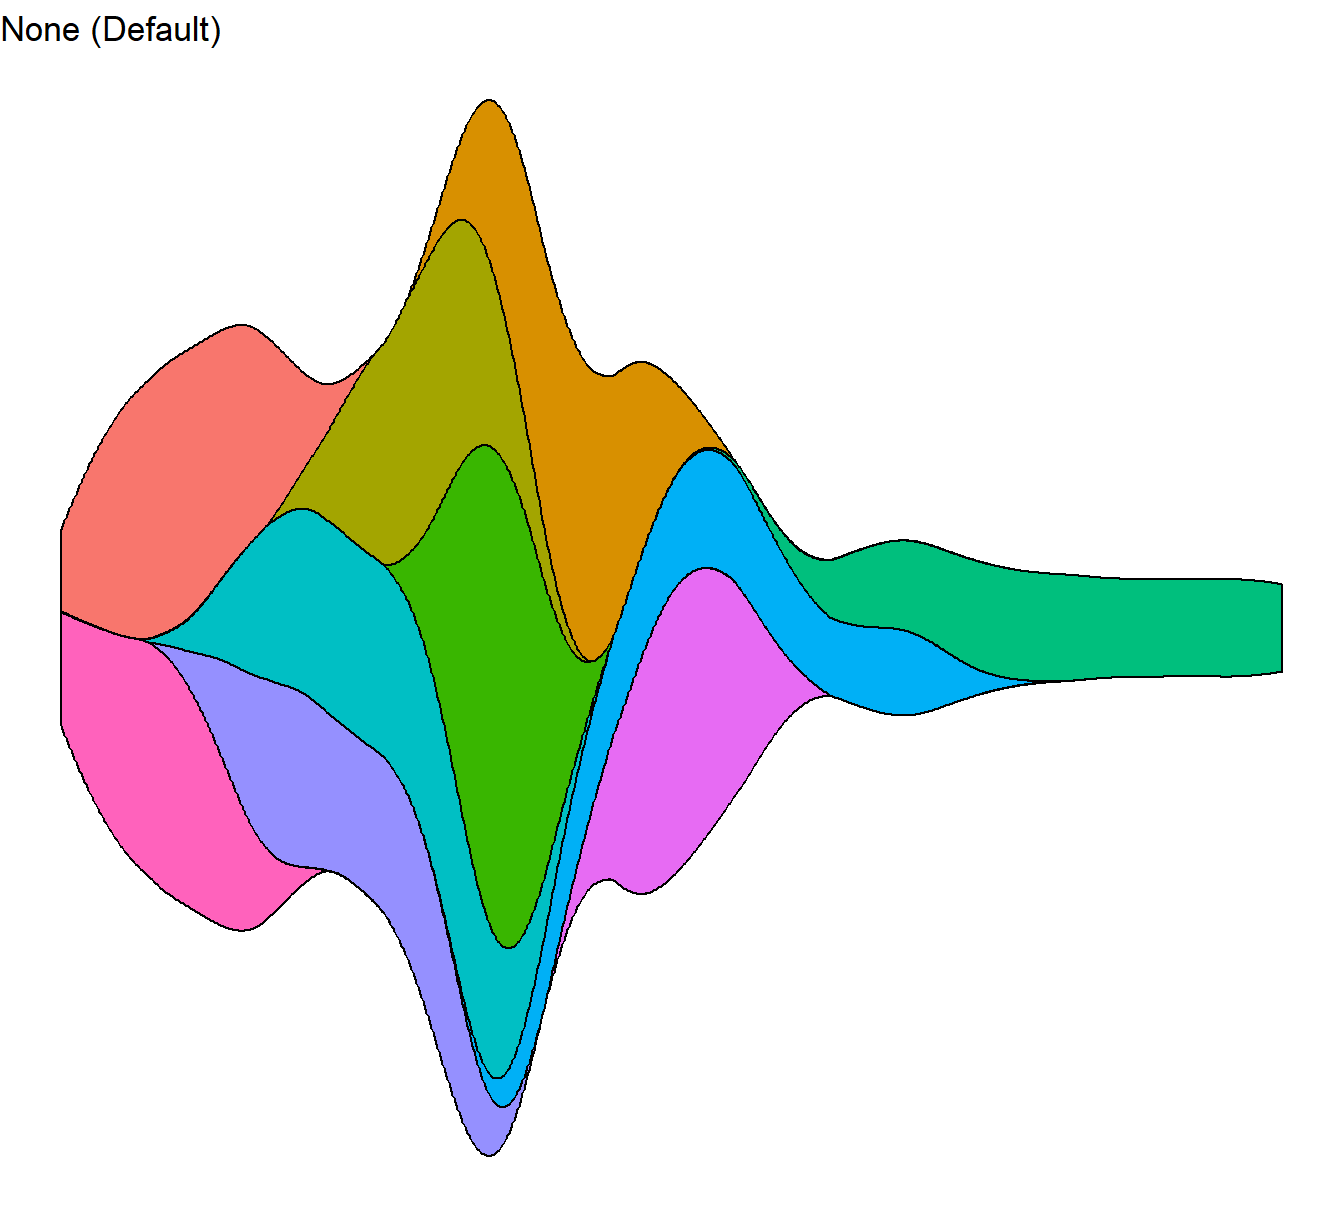
12.3 估计范围 (extra range used in estimation)
base <- ggplot(blockbusters, aes(year, box_office, fill = genre)) +
  theme(legend.position = "none") +
  xlim(1970, 2028)

base + geom_stream() + ggtitle("Default") 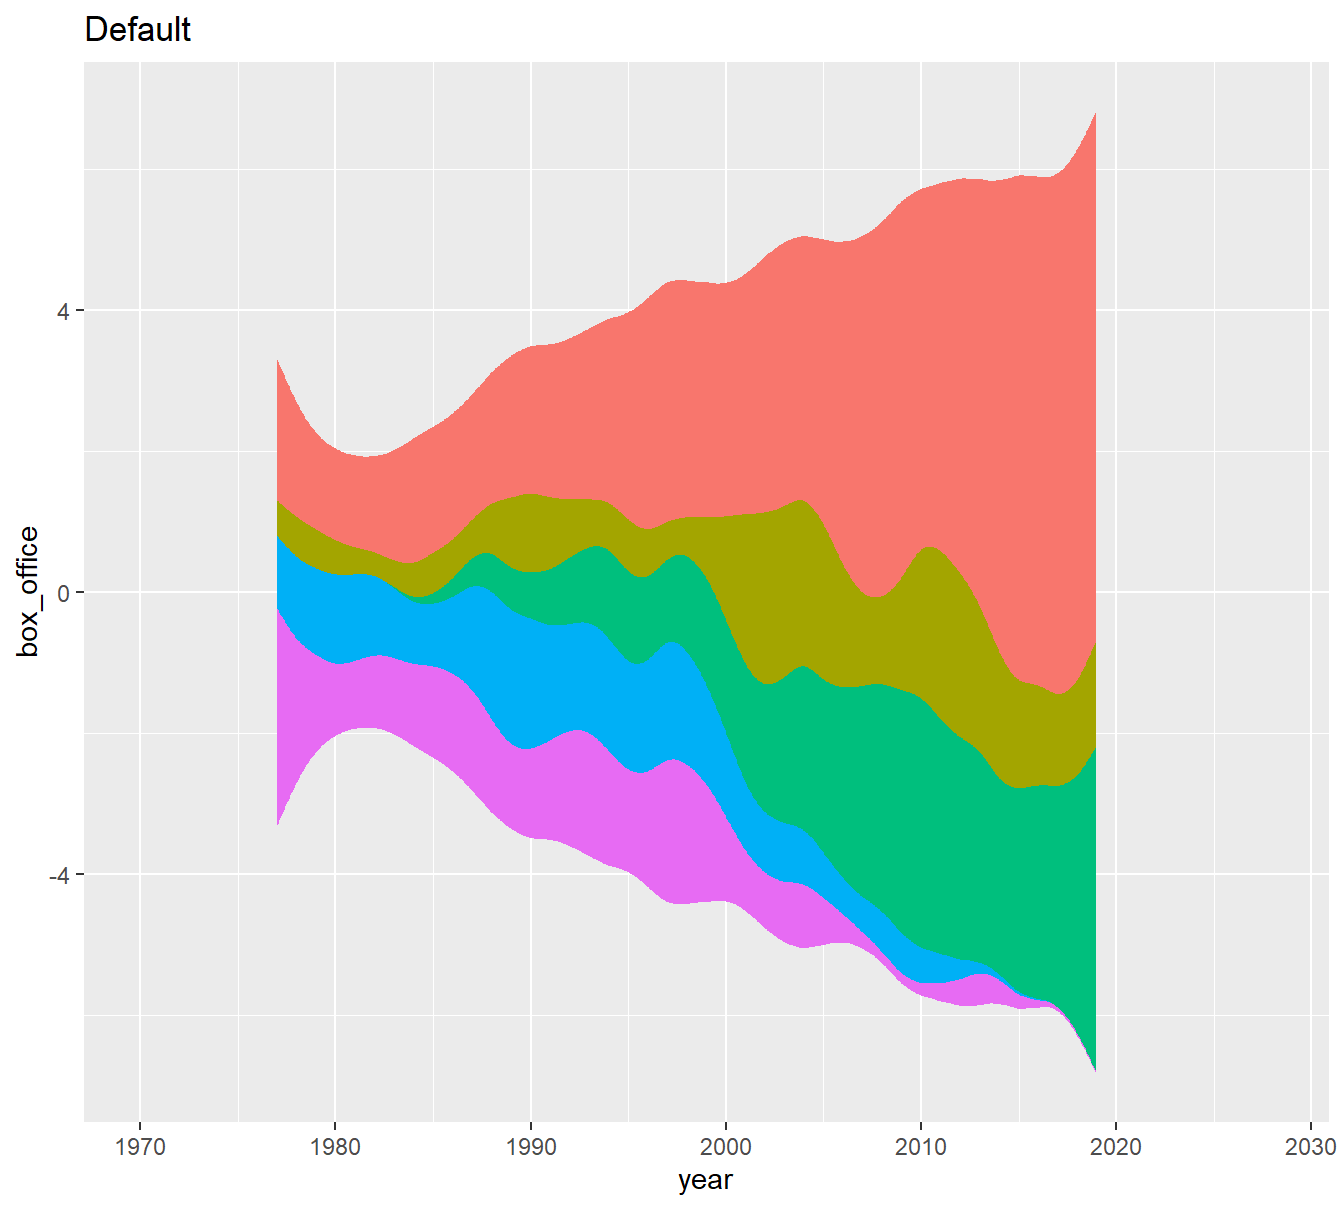
base + geom_stream(extra_span = 0.001) + geom_stream(extra_span = 0.001, true_range = "none", alpha = .3) + ggtitle("extra_span = 0.001")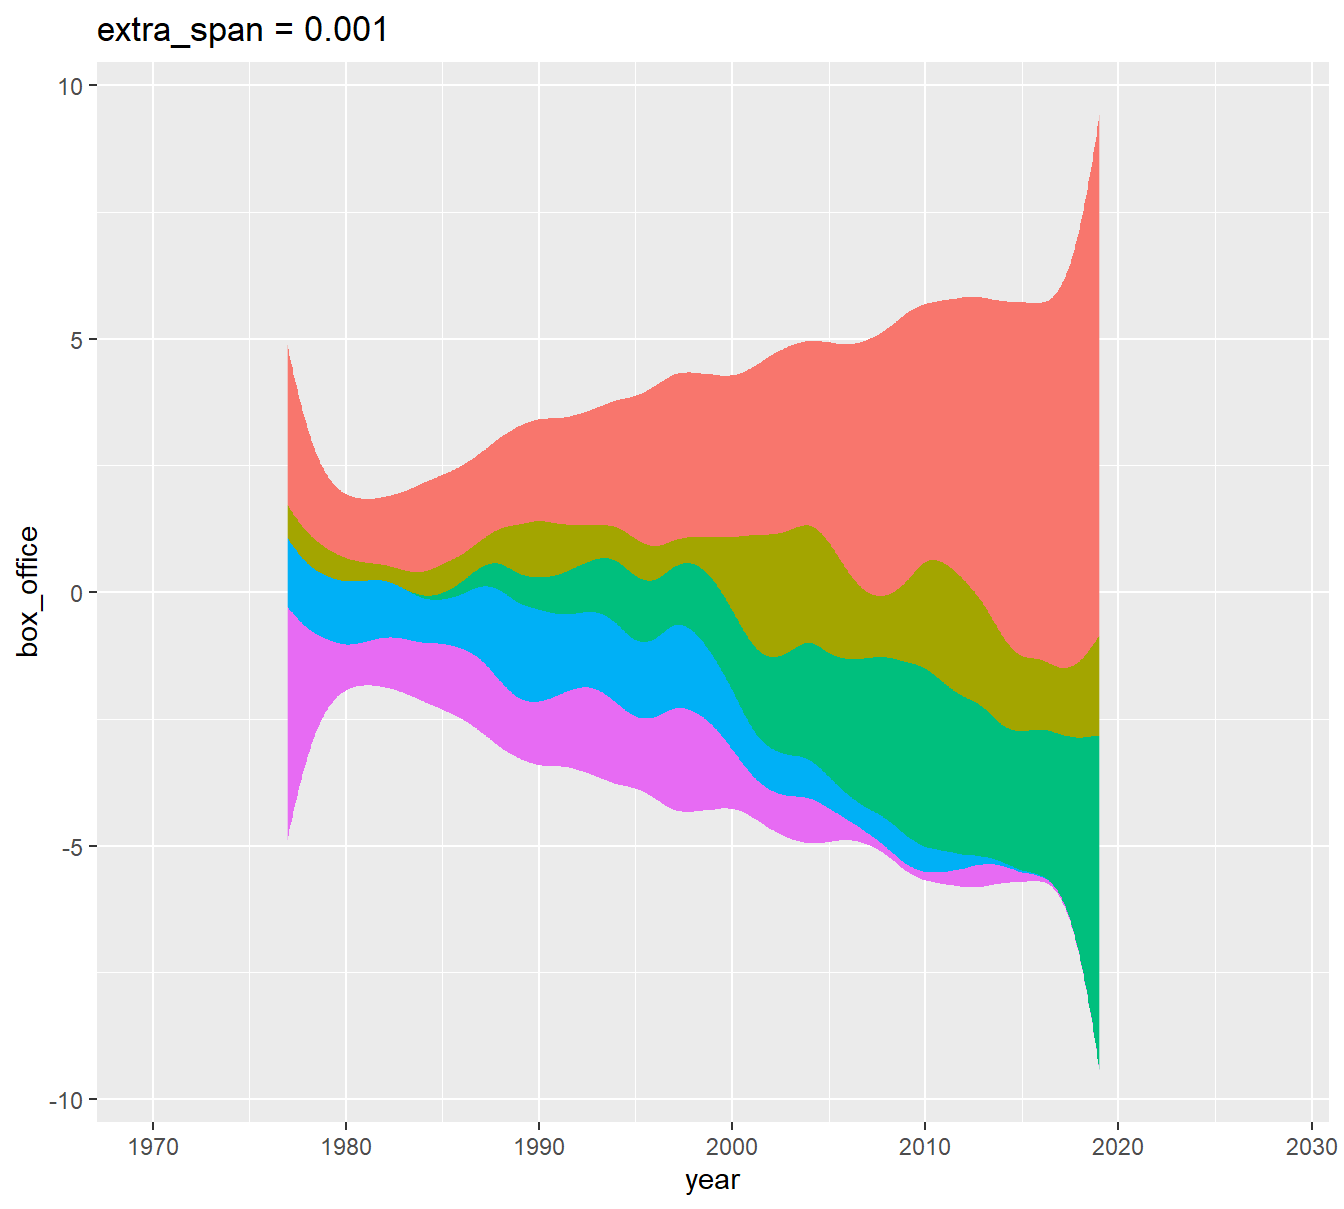
base + geom_stream(extra_span = .1) + geom_stream(extra_span = .1, true_range = "none", alpha = .3) + ggtitle("extra_span = .1") 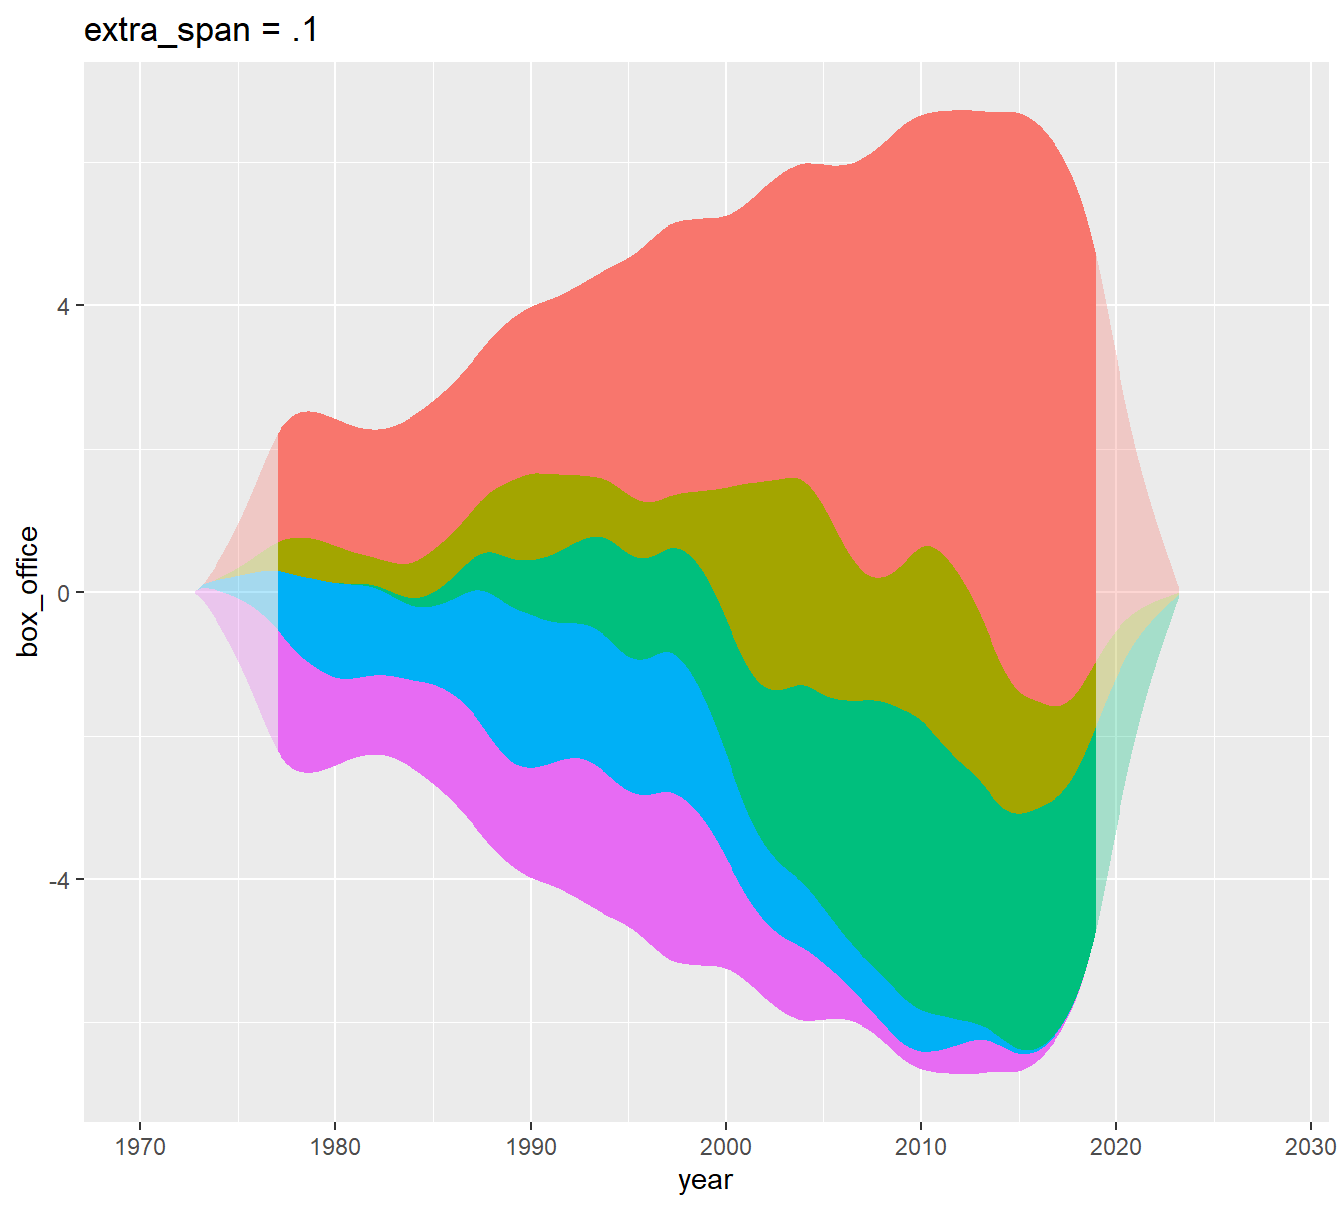
base + geom_stream(extra_span = .2) + geom_stream(extra_span = .2, true_range = "none", alpha = .3) + ggtitle("extra_span = .2") 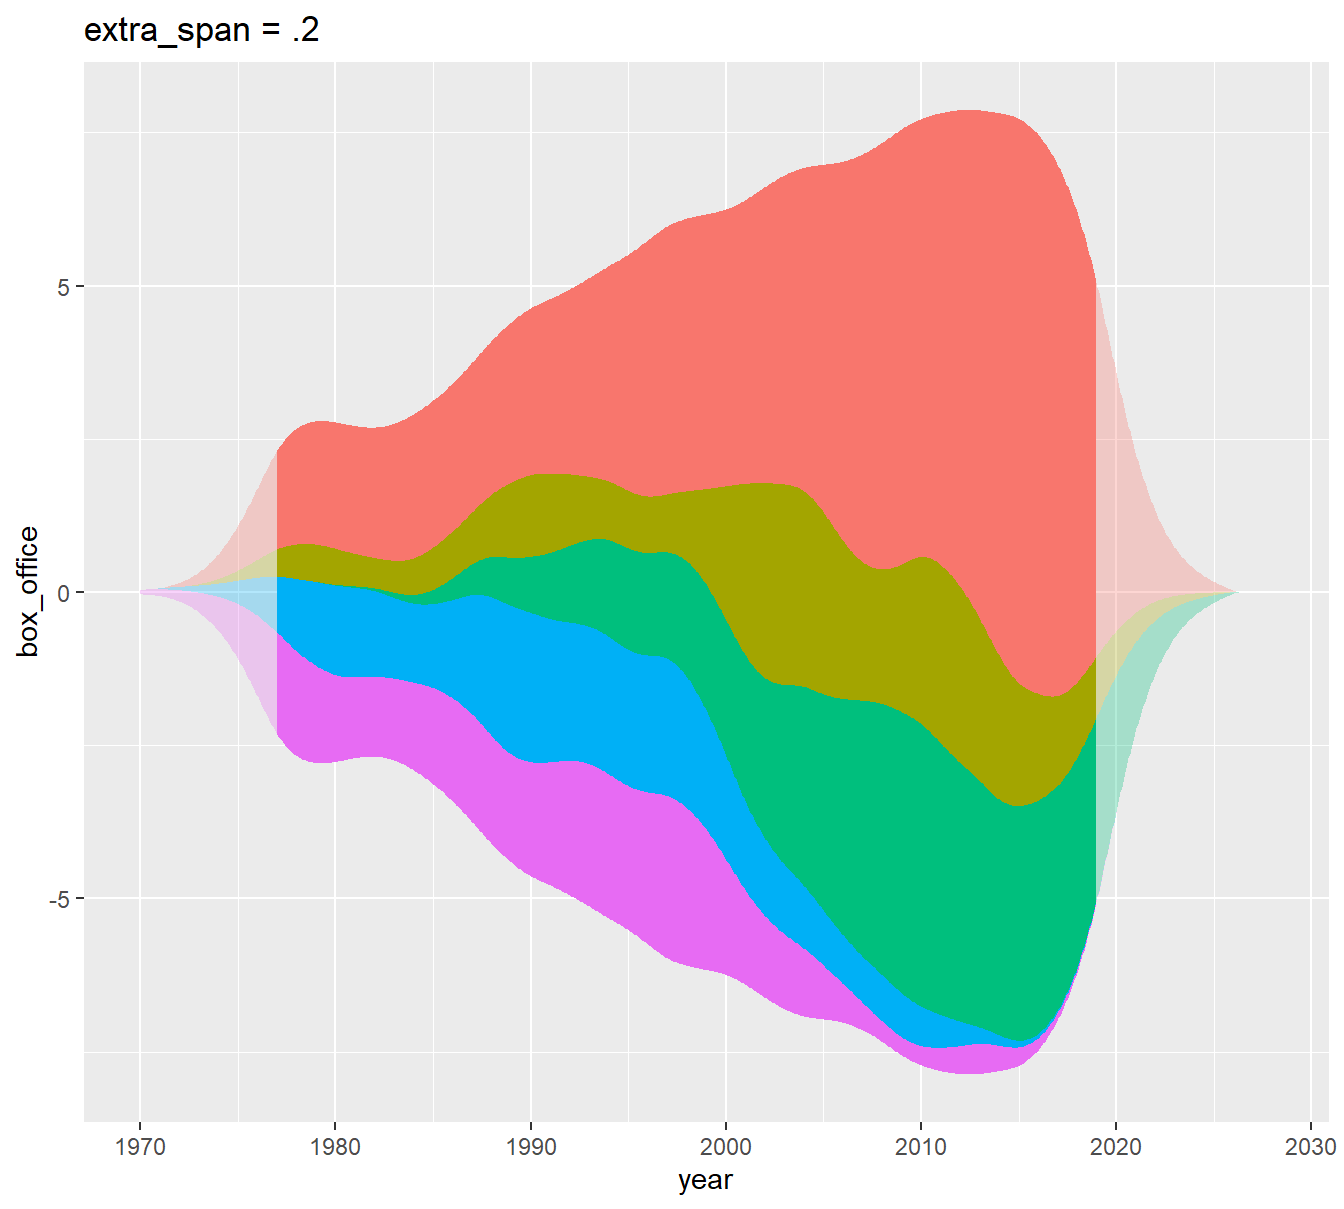
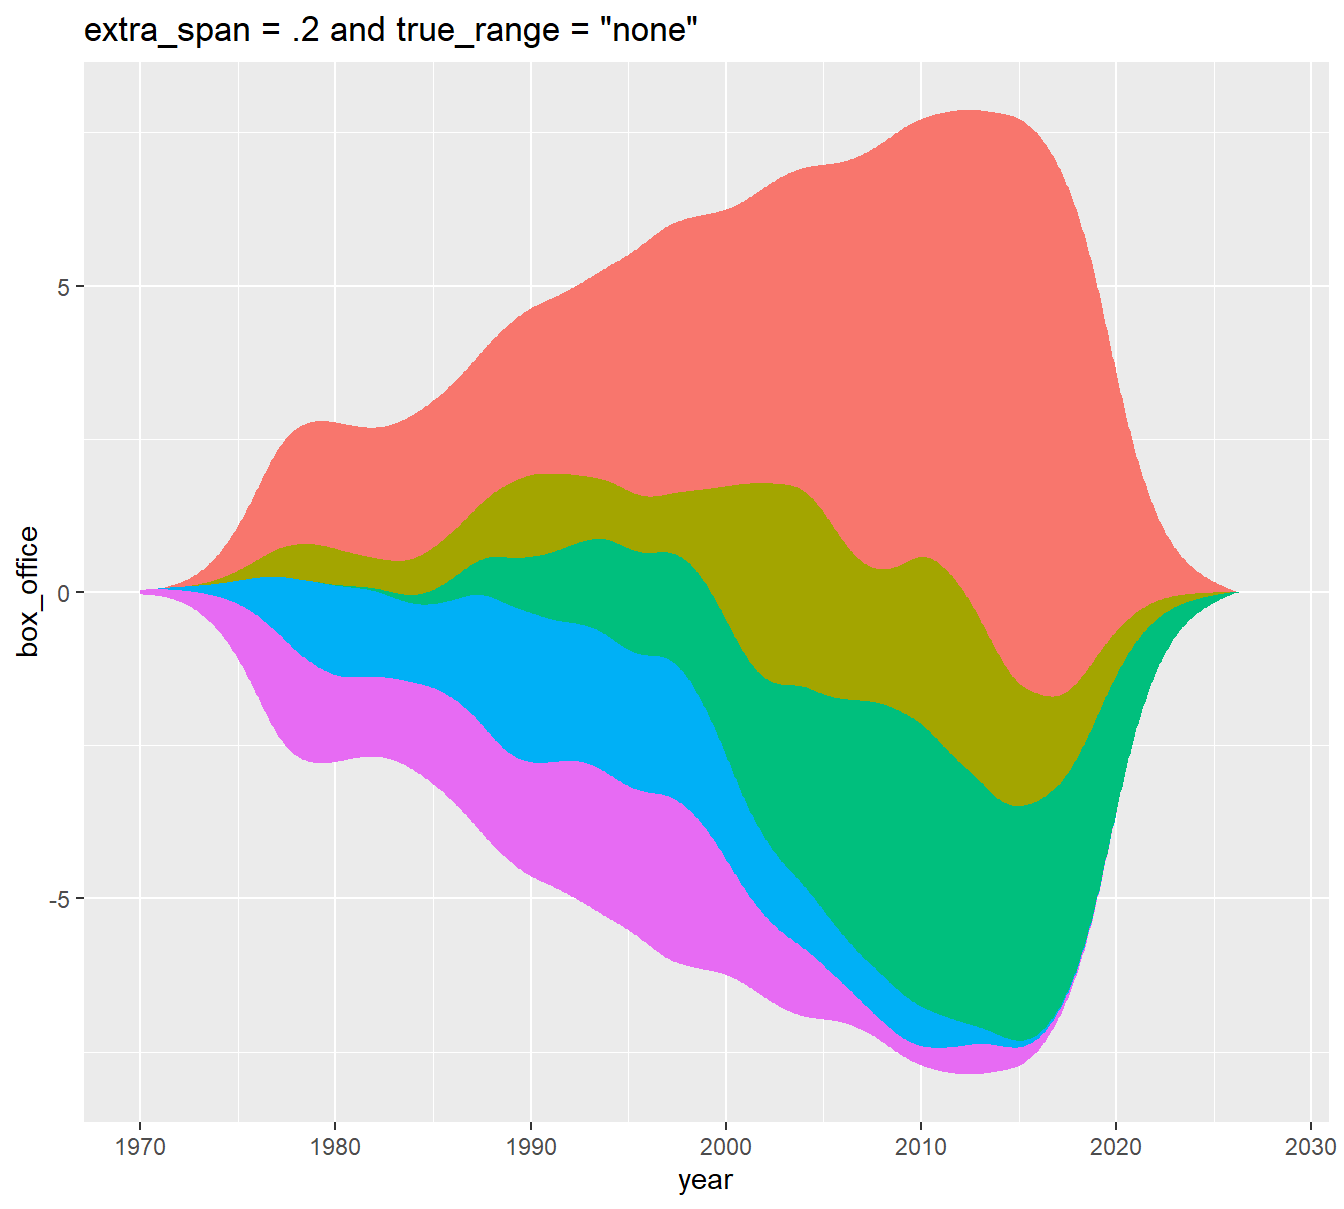
base + geom_stream(extra_span = .2, true_range = "none") + ggtitle("extra_span = .2 and true_range = \"none\"")