第 9 章 雷达图
9.1 基本雷达图
library(fmsb)

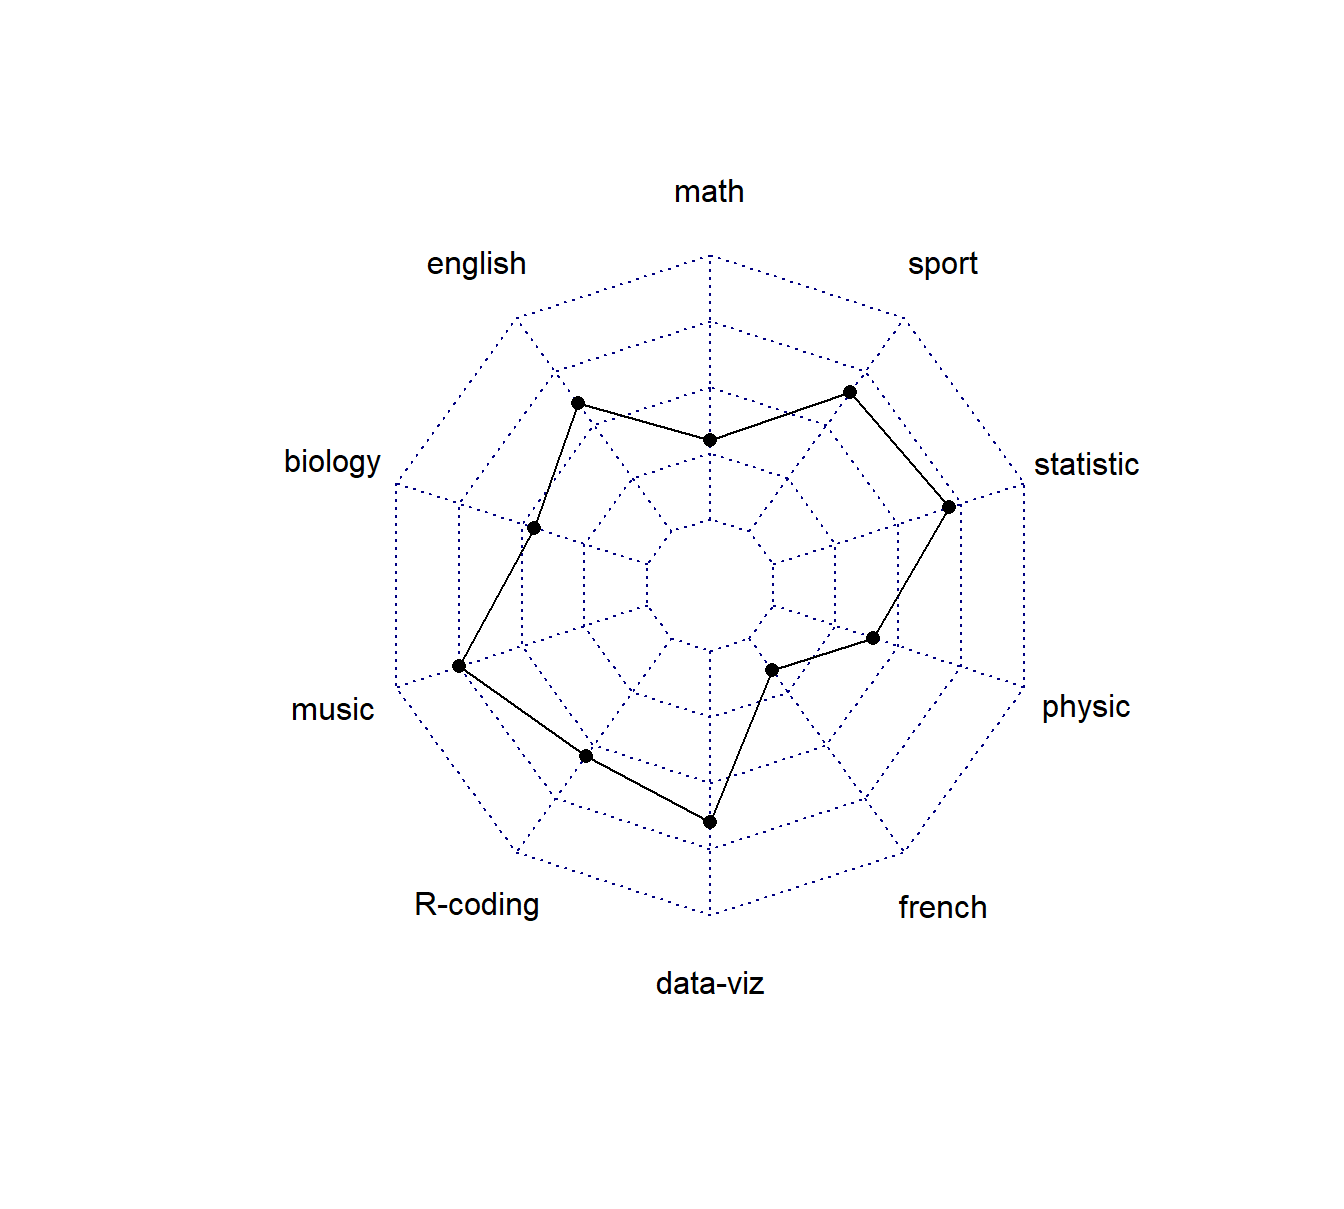
data <- as.data.frame(matrix( sample( 2:20 , 10 , replace=T) , ncol=10))
colnames(data) <- c("math" , "english" , "biology" , "music" , "R-coding", "data-viz" , "french" , "physic", "statistic", "sport" )

# To use the fmsb package, I have to add 2 lines to the dataframe: the max and min of each topic to show on the plot!
data <- rbind(rep(20,10) , rep(0,10) , data)
kableExtra::kable(data)| math | english | biology | music | R-coding | data-viz | french | physic | statistic | sport |
|---|---|---|---|---|---|---|---|---|---|
| 20 | 20 | 20 | 20 | 20 | 20 | 20 | 20 | 20 | 20 |
| 0 | 0 | 0 | 0 | 0 | 0 | 0 | 0 | 0 | 0 |
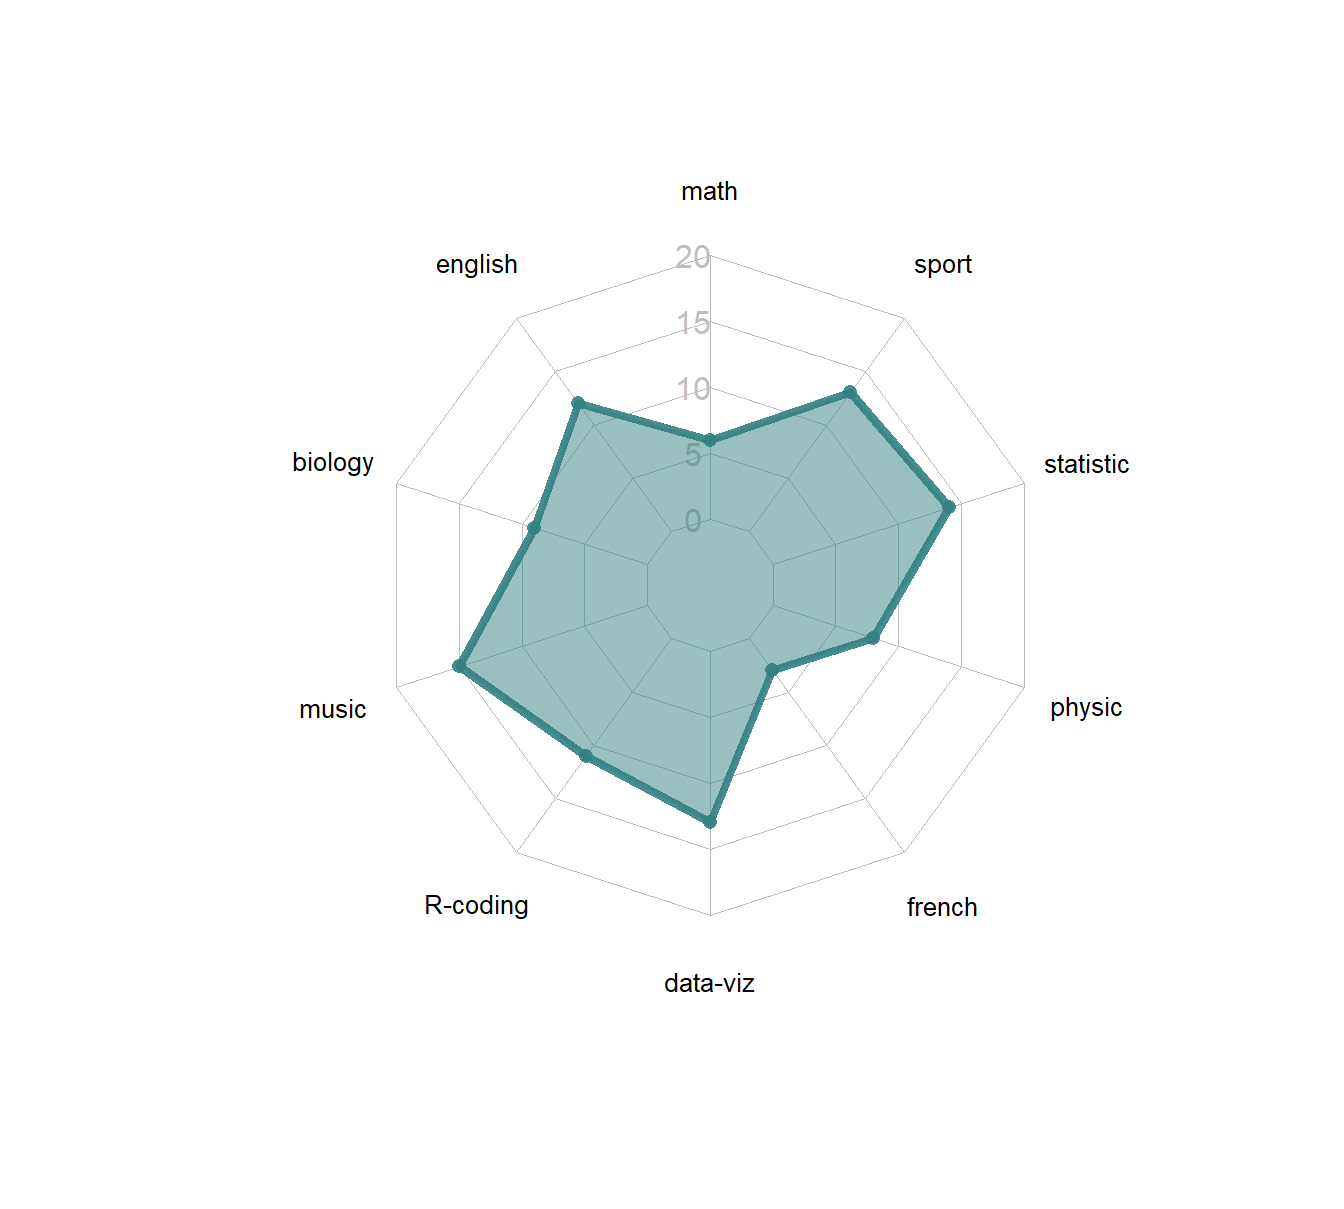
| 6 | 12 | 9 | 15 | 11 | 13 | 3 | 8 | 14 | 13 |
9.1.1 自定义样式
- Polygon features:
- pcol → line color
- pfcol → fill color
- plwd → line width
- Grid features:
- cglcol → color of the net
- cglty → net line type (see possibilities)
- axislabcol → color of axis labels
- caxislabels → vector of axis labels to display
- cglwd → net width
- Labels:
- vlcex → group labels size
# Library
library(fmsb)

# Custom the radarChart !
radarchart( data  , axistype=1 ,

    #custom polygon
    pcol=rgb(0.2,0.5,0.5,0.9) , pfcol=rgb(0.2,0.5,0.5,0.5) , plwd=4 ,

    #custom the grid
    cglcol="grey", cglty=1, axislabcol="grey", caxislabels=seq(0,20,5), cglwd=0.8,

    #custom labels
    vlcex=0.8
    )
9.2 分组雷达图
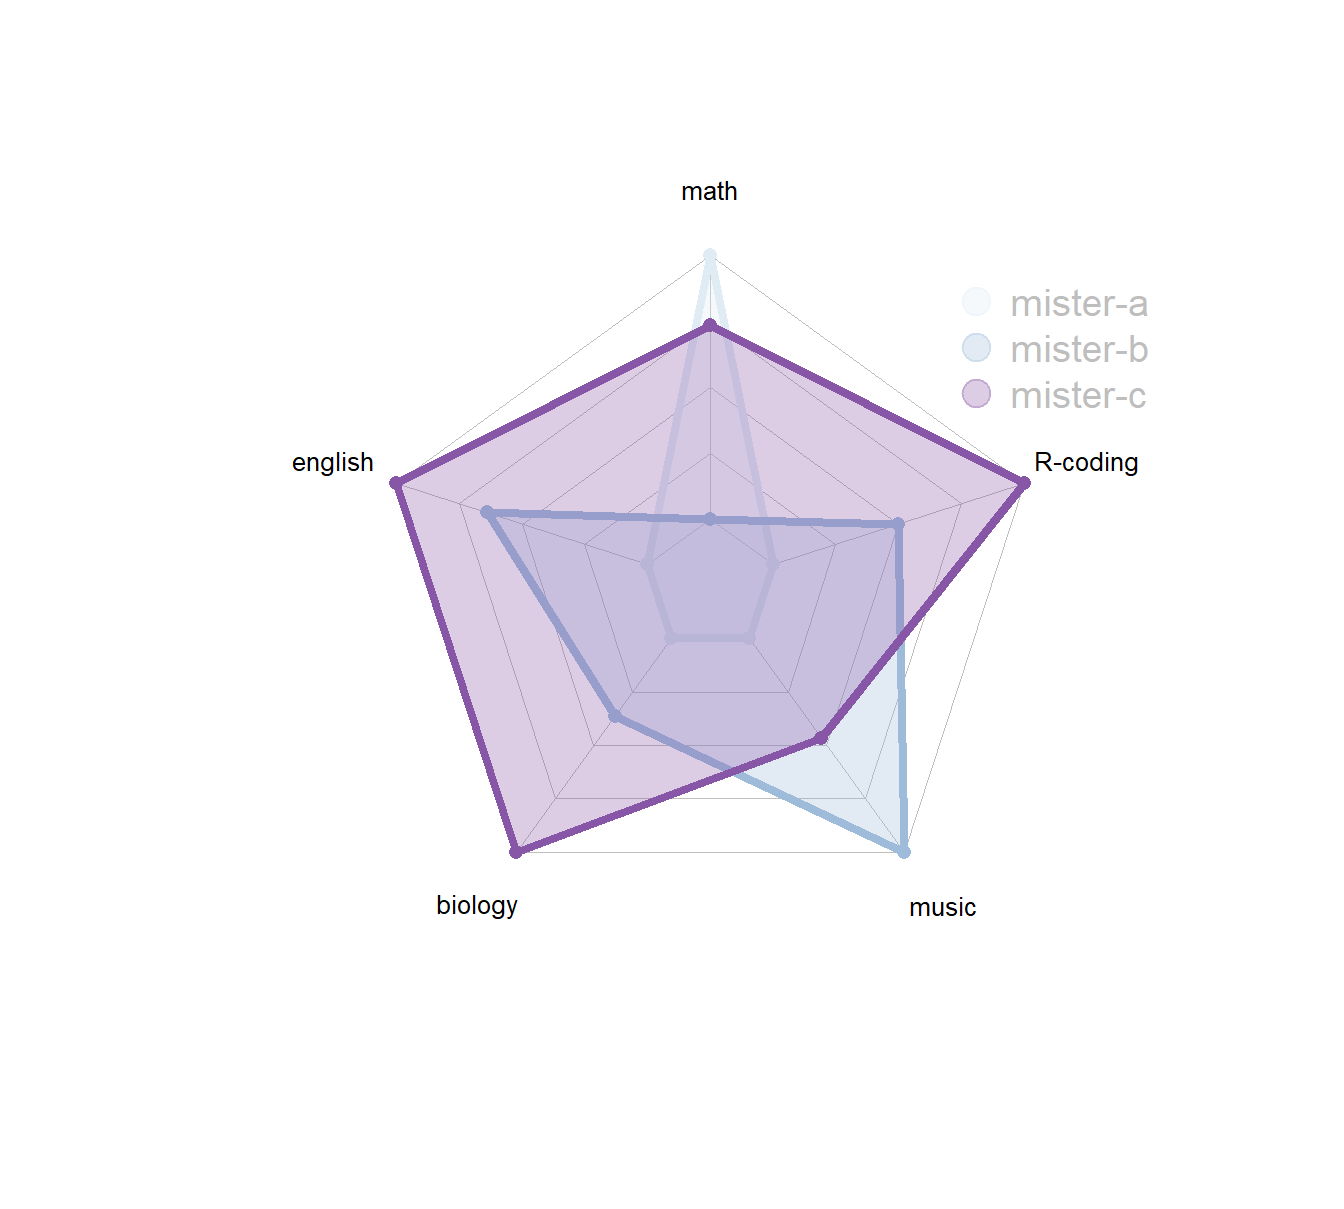
set.seed(99)
data <- as.data.frame(matrix( sample( 0:20 , 15 , replace=F) , ncol=5))
colnames(data) <- c("math" , "english" , "biology" , "music" , "R-coding" )
rownames(data) <- paste("mister" , letters[1:3] , sep="-")

# To use the fmsb package, I have to add 2 lines to the dataframe: the max and min of each variable to show on the plot!
data <- rbind(rep(20,5) , rep(0,5) , data)
kableExtra::kable(data)| math | english | biology | music | R-coding | |
|---|---|---|---|---|---|
| 1 | 20 | 20 | 20 | 20 | 20 |
| 2 | 0 | 0 | 0 | 0 | 0 |
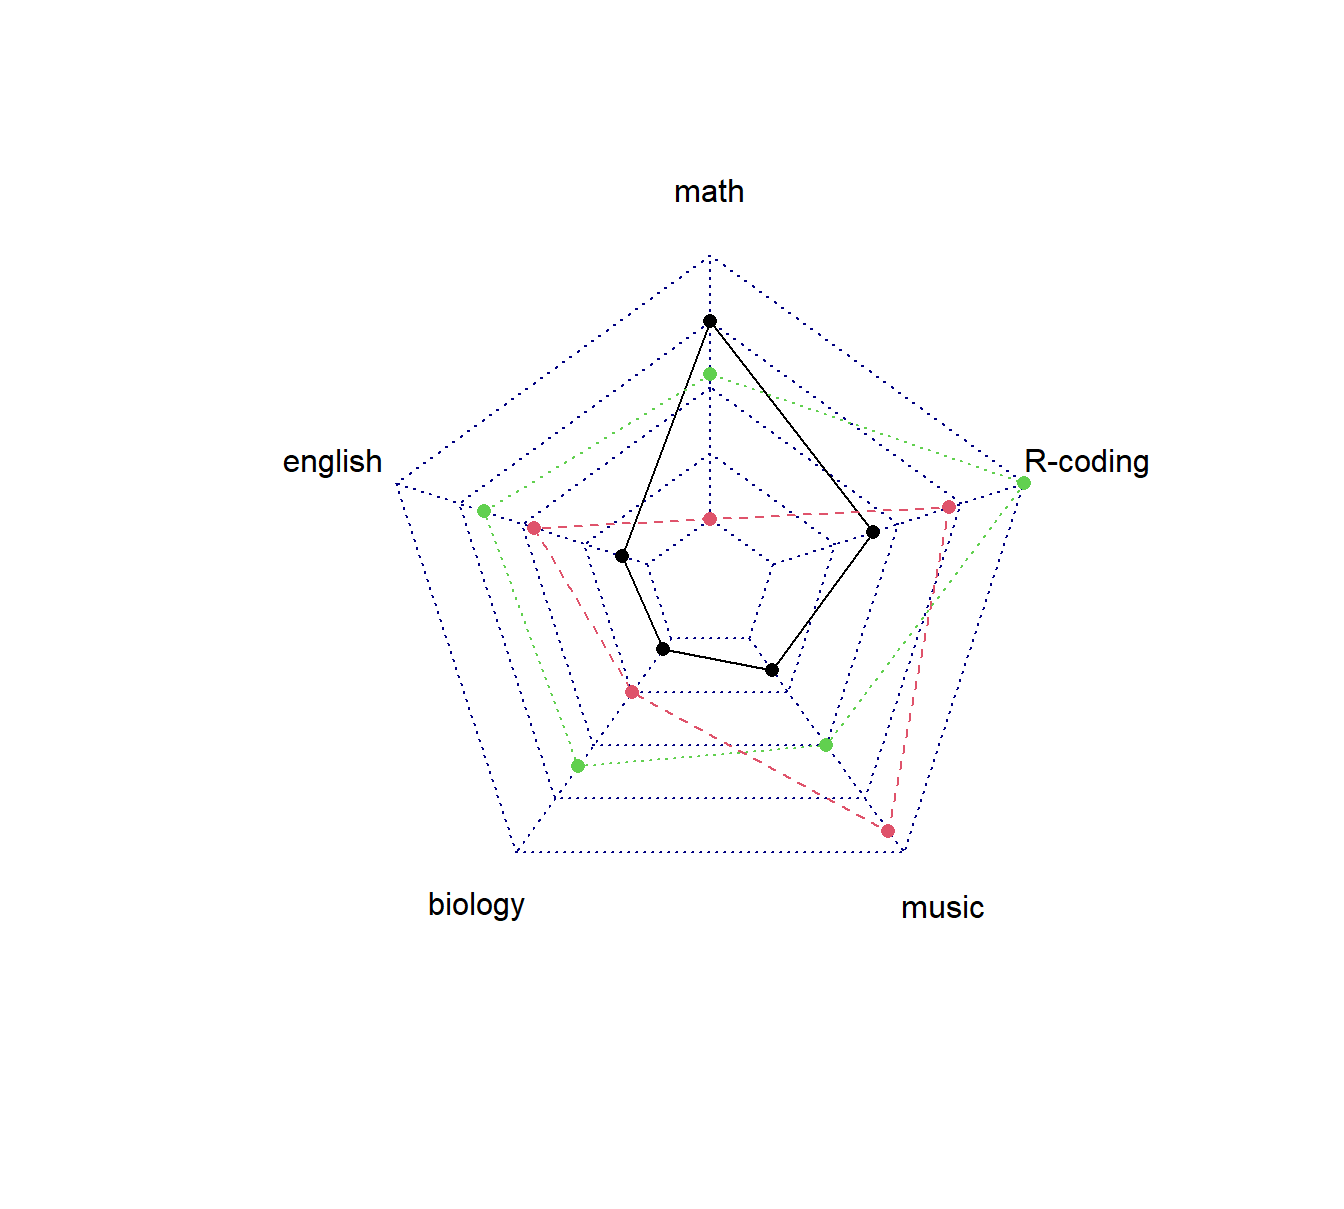
| mister-a | 15 | 2 | 1 | 3 | 8 |
| mister-b | 0 | 9 | 5 | 18 | 14 |
| mister-c | 11 | 13 | 12 | 10 | 20 |
9.2.1 自定义样式
set.seed(99)
data <- as.data.frame(matrix( sample( 0:20 , 15 , replace=F) , ncol=5))
colnames(data) <- c("math" , "english" , "biology" , "music" , "R-coding" )
rownames(data) <- paste("mister" , letters[1:3] , sep="-")

# To use the fmsb package, I have to add 2 lines to the dataframe: the max and min of each variable to show on the plot!
data <- rbind(rep(20,5) , rep(0,5) , data)

# Color vector
colors_border=c( rgb(0.2,0.5,0.5,0.9), rgb(0.8,0.2,0.5,0.9) , rgb(0.7,0.5,0.1,0.9) )
colors_in=c( rgb(0.2,0.5,0.5,0.4), rgb(0.8,0.2,0.5,0.4) , rgb(0.7,0.5,0.1,0.4) )

# plot with default options:
radarchart( data  , axistype=1 ,
    #custom polygon
    pcol=colors_border , pfcol=colors_in , plwd=4 , plty=1,
    #custom the grid
    cglcol="grey", cglty=1, axislabcol="grey", caxislabels=seq(0,20,5), cglwd=0.8,
    #custom labels
    vlcex=0.8
    )

# Add a legend
legend(x=0.7, y=1, legend = rownames(data[-c(1,2),]), bty = "n", pch=20 , col=colors_in , text.col = "grey", cex=1.2, pt.cex=3)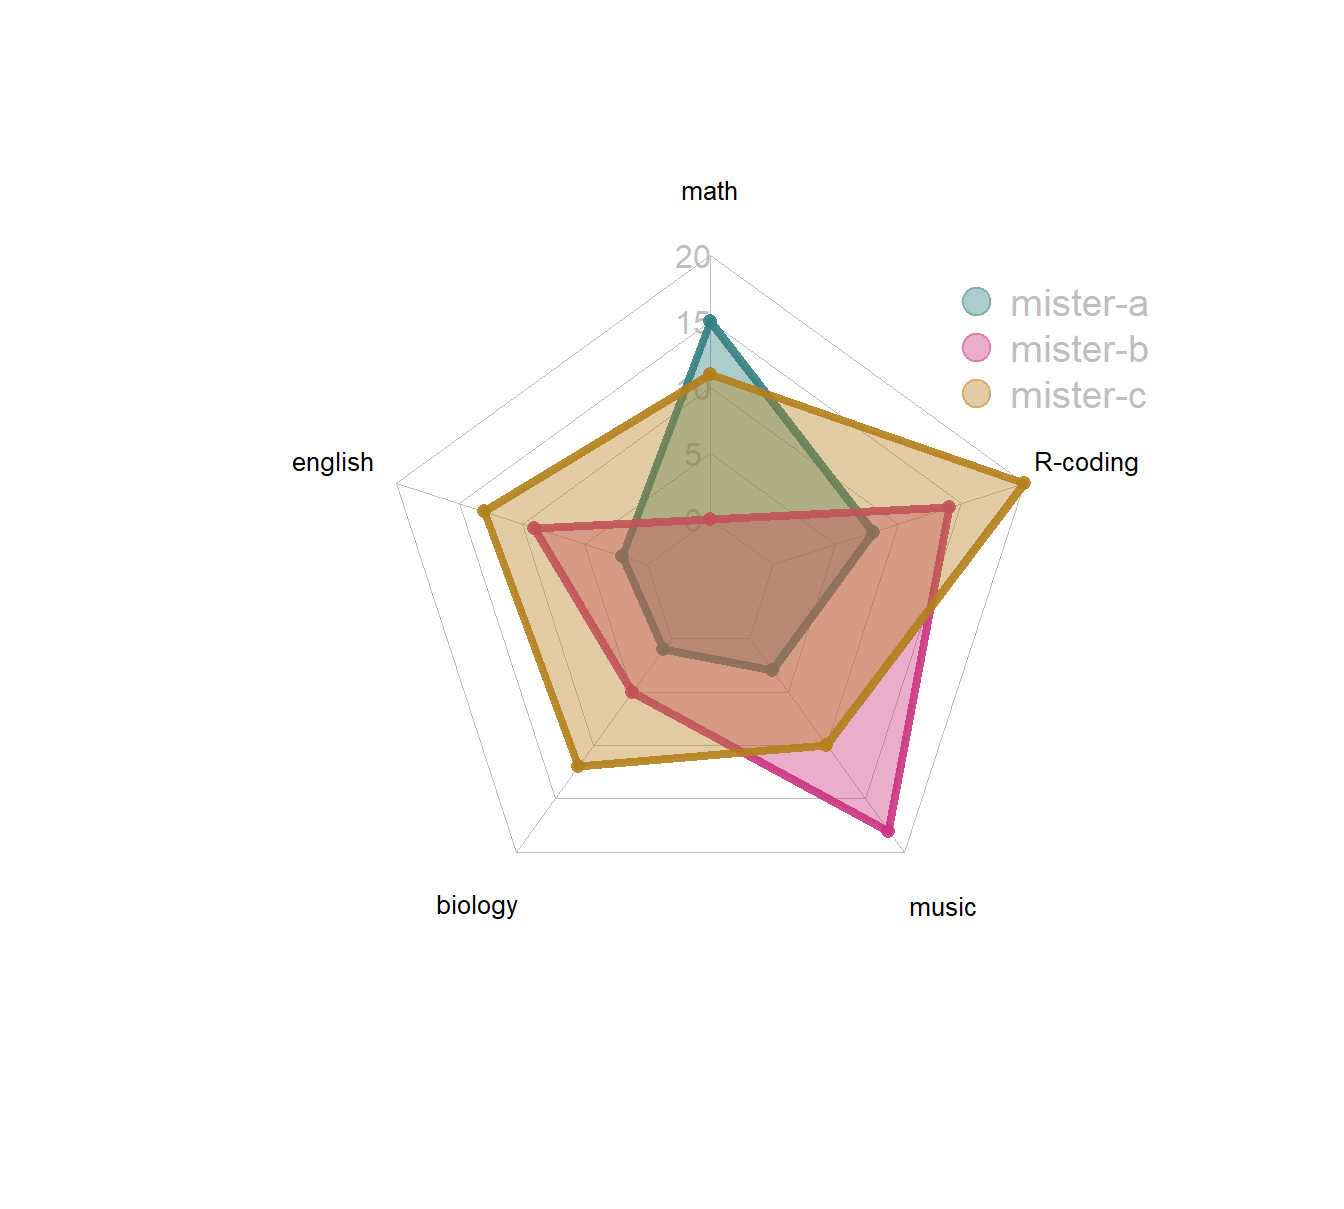
9.2.2 坐标轴限制
set.seed(99)
data <- as.data.frame(matrix( sample( 0:20 , 15 , replace=F) , ncol=5))
colnames(data) <- c("math" , "english" , "biology" , "music" , "R-coding" )
rownames(data) <- paste("mister" , letters[1:3] , sep="-")

# To use the fmsb package, I have to add 2 lines to the dataframe: the max and min of each variable to show on the plot!
data <- rbind(rep(20,5) , rep(0,5) , data)

# Set graphic colors
library(RColorBrewer)
coul <- brewer.pal(3, "BuPu")
colors_border <- coul
library(scales)
colors_in <- alpha(coul,0.3)

# If you remove the 2 first lines, the function compute the max and min of each variable with the available data:
radarchart( data[-c(1,2),]  , axistype=0 , maxmin=F,
    #custom polygon
    pcol=colors_border , pfcol=colors_in , plwd=4 , plty=1,
    #custom the grid
    cglcol="grey", cglty=1, axislabcol="black", cglwd=0.8,
    #custom labels
    vlcex=0.8
    )

# Add a legend
legend(x=0.7, y=1, legend = rownames(data[-c(1,2),]), bty = "n", pch=20 , col=colors_in , text.col = "grey", cex=1.2, pt.cex=3)