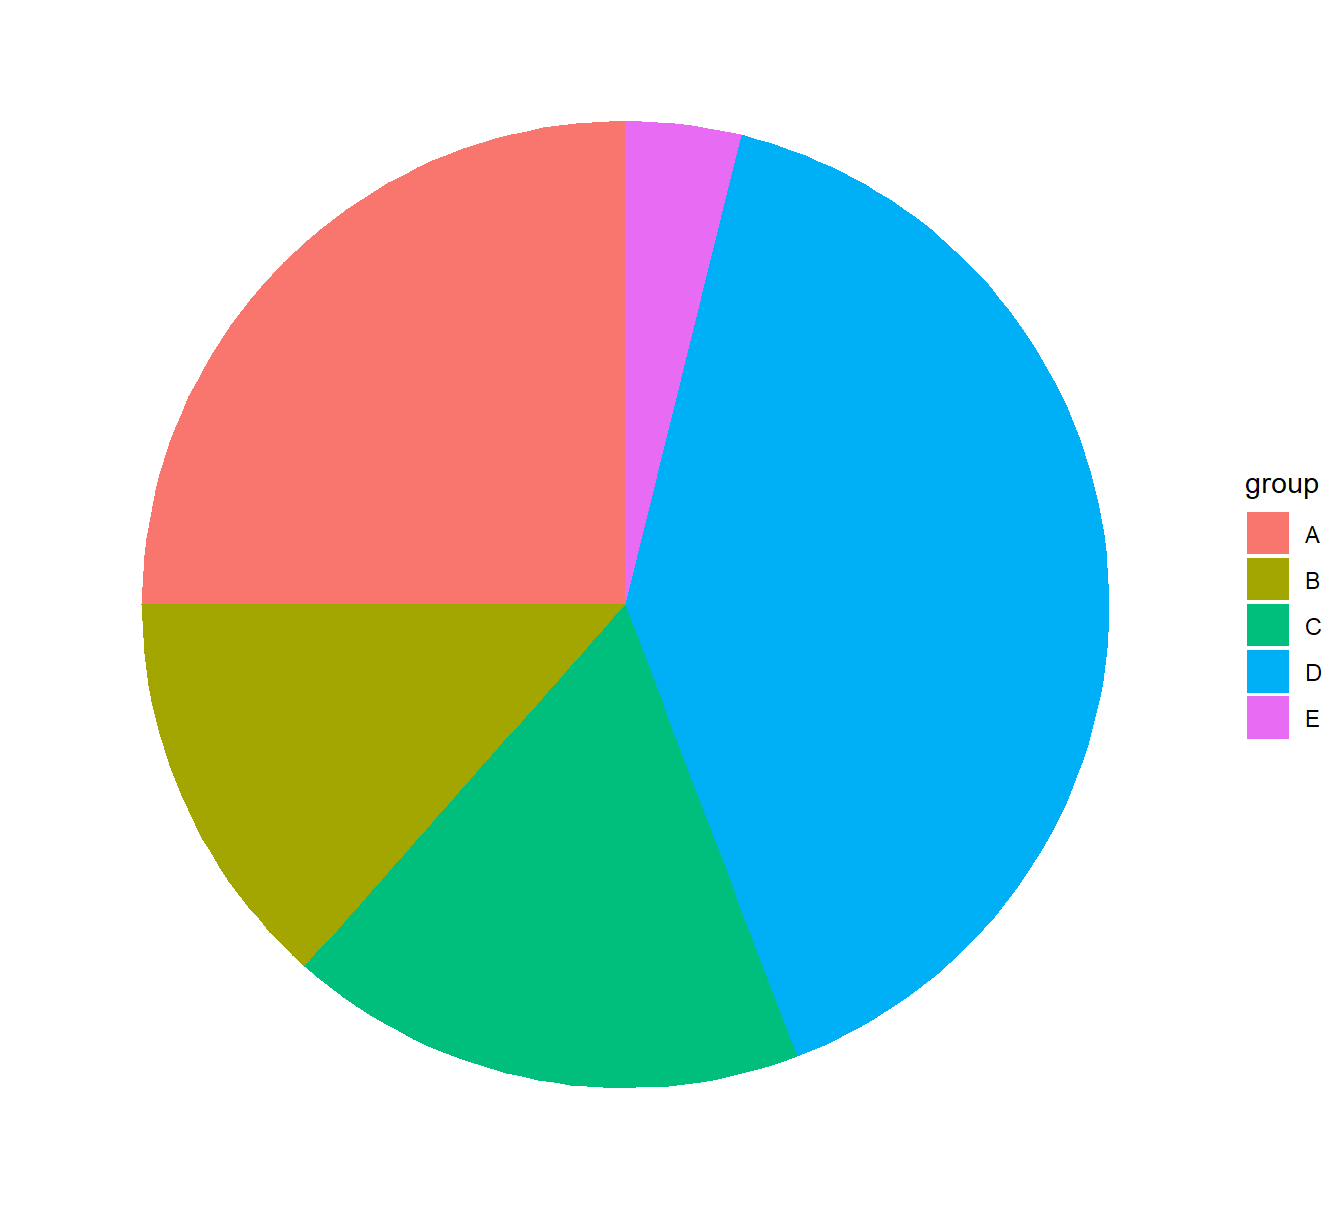
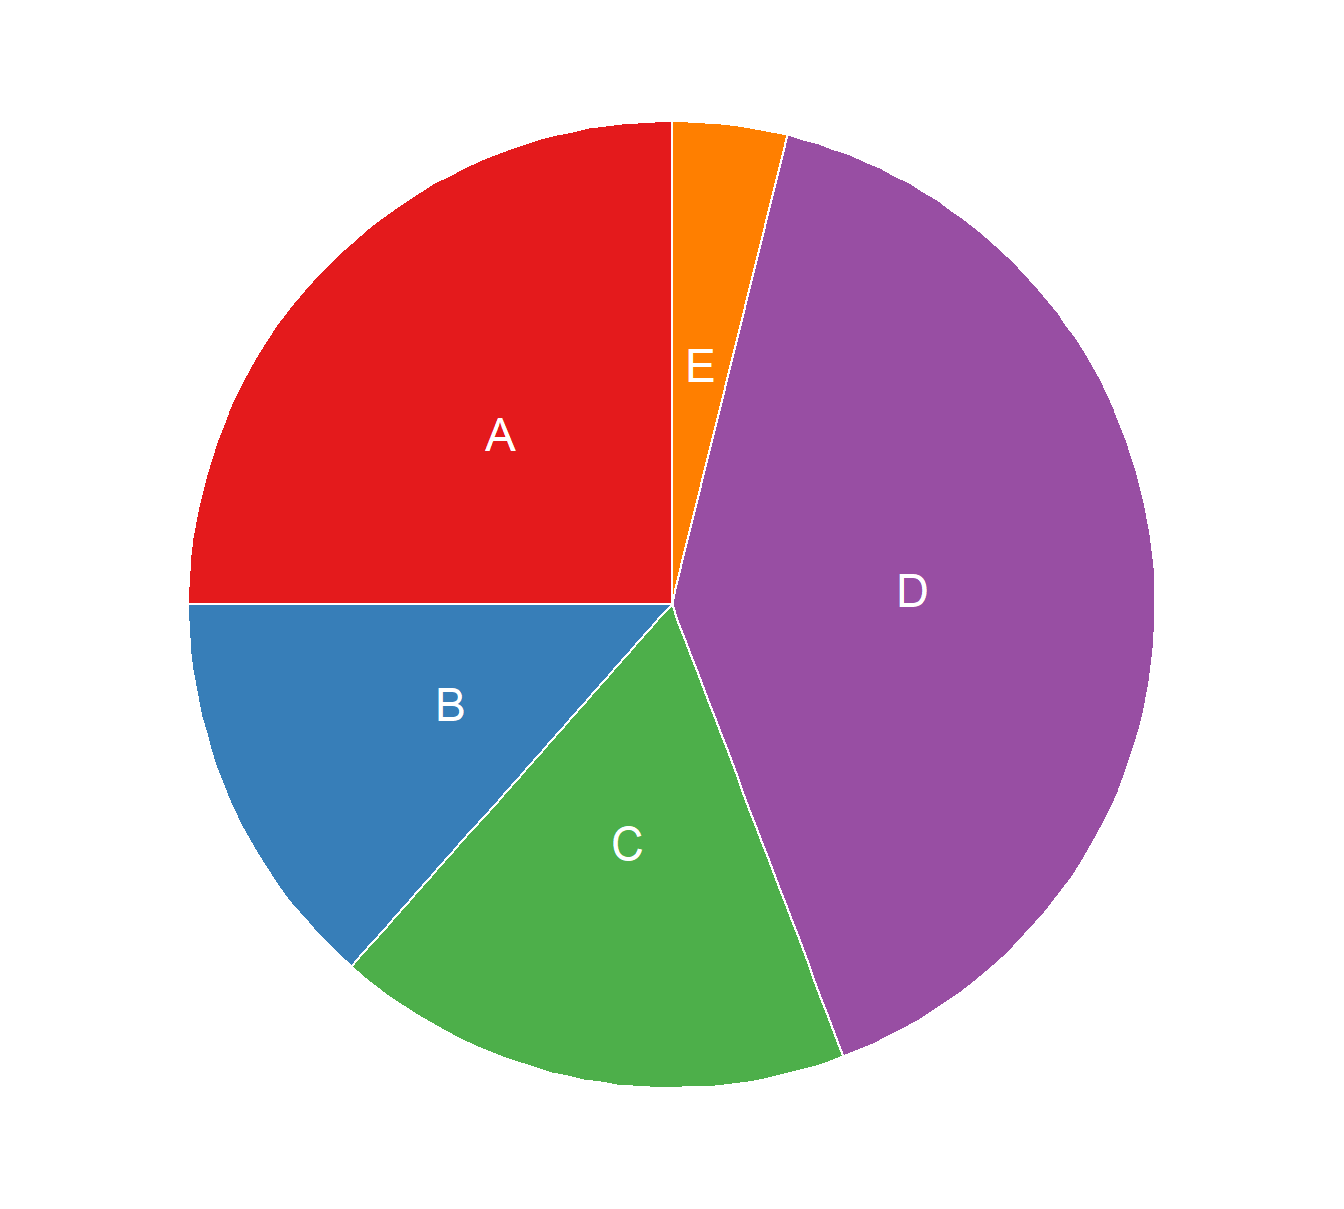
data <- data.frame(
  group=LETTERS[1:5],
  value=c(13,7,9,21,2)
)

# Compute the position of labels
data <- data %>%
  arrange(desc(group)) %>%
  mutate(prop = value / sum(data$value) *100) %>%
  mutate(ypos = cumsum(prop)- 0.5*prop )

# Basic piechart
ggplot(data, aes(x="", y=prop, fill=group)) +
  geom_bar(stat="identity", width=1, color="white") +
  coord_polar("y", start=0) +
  theme_void() +
  theme(legend.position="none") +

  geom_text(aes(y = ypos, label = group), color = "white", size=6) +
  scale_fill_brewer(palette="Set1")

