第 3 章 箱型图
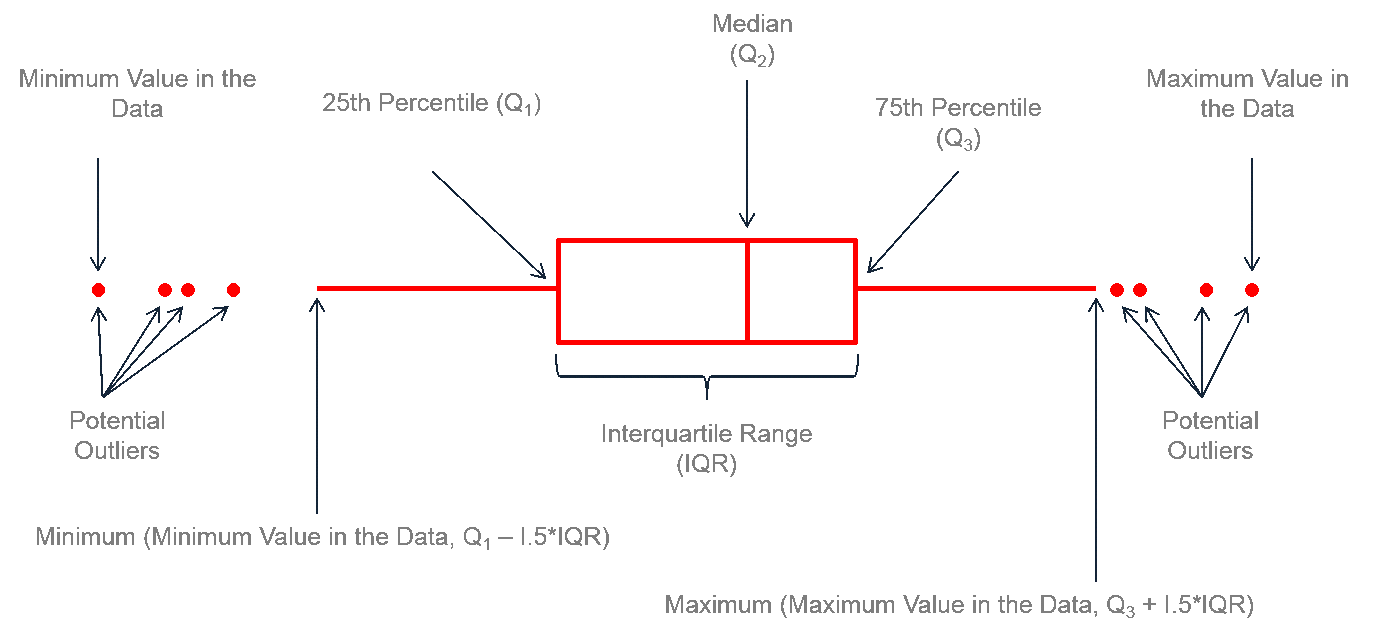
图 3.1: BoxPlotAnatomy
3.1 基本箱型图
ggplot(mtcars, aes(x=as.factor(cyl), y=mpg)) +
    geom_boxplot(fill="slateblue", alpha=0.2) +
    xlab("cyl")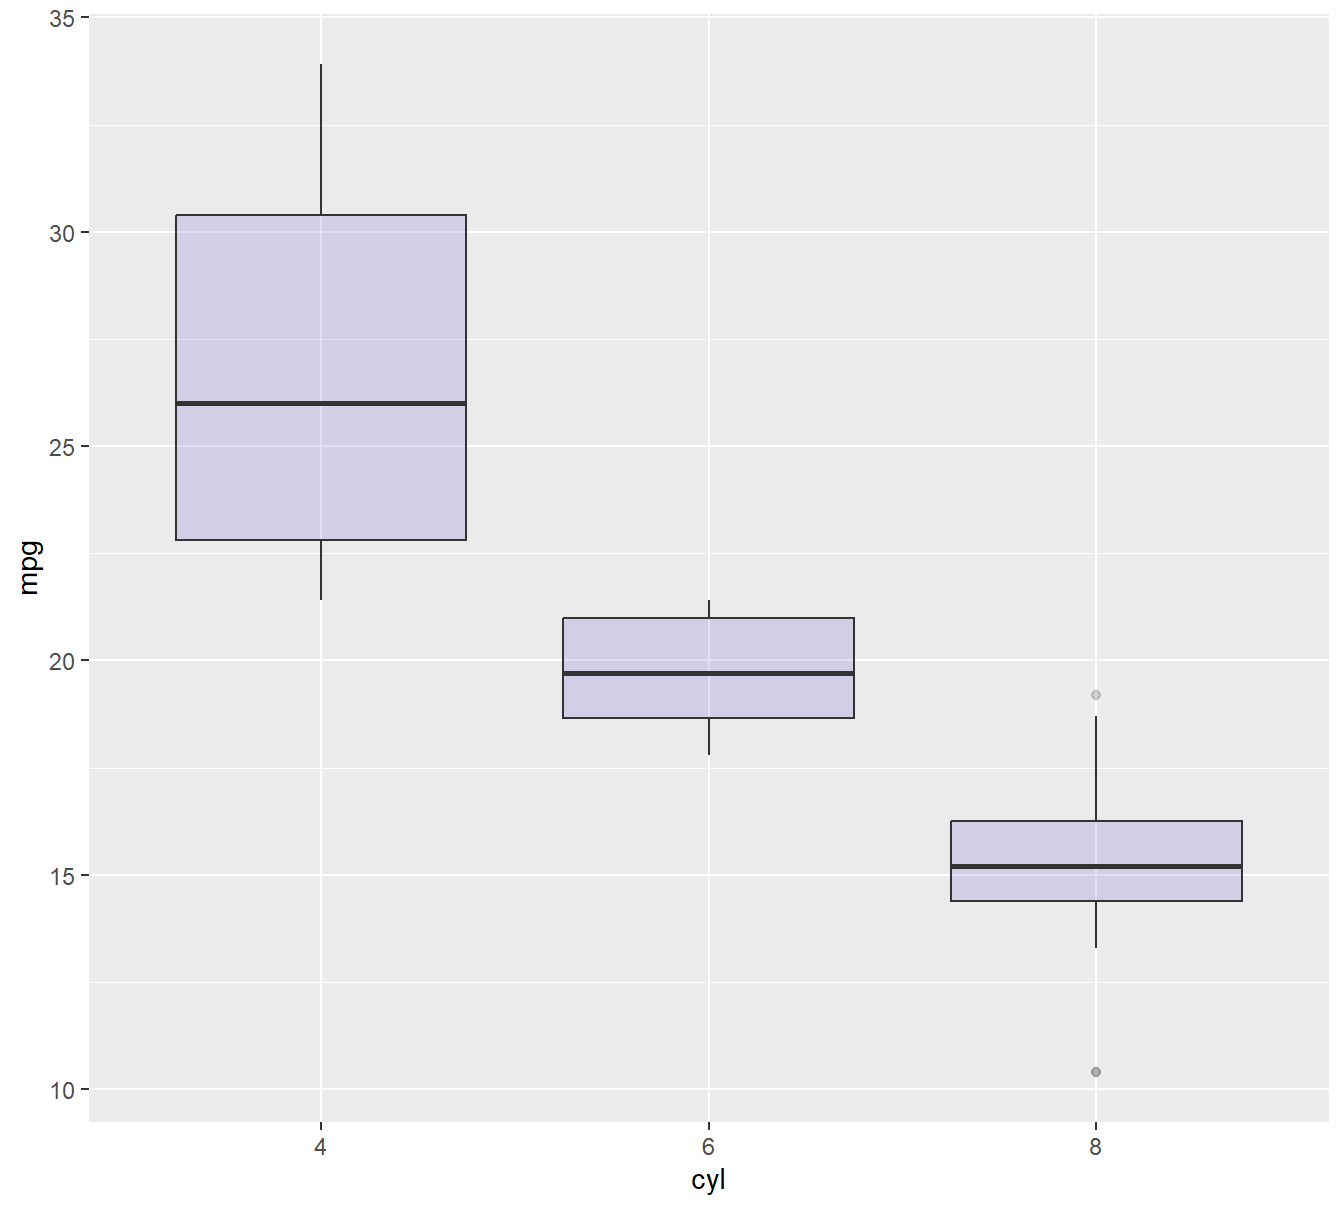
3.1.1 添加观测点
data3 <- data.frame(
  name=c( rep("A",500), rep("B",500), rep("B",500), rep("C",20), rep('D', 100)  ),
  value=c( rnorm(500, 10, 5), rnorm(500, 13, 1), rnorm(500, 18, 1), rnorm(20, 25, 4), rnorm(100, 12, 1) )
)

# Plot
data3 %>%
  ggplot( aes(x=name, y=value, fill=name)) +
    geom_boxplot() +
    scale_fill_viridis(discrete = TRUE, alpha=0.6) +
    geom_jitter(color="black", size=0.4, alpha=0.9) +
    theme_ipsum() +
    theme(
      legend.position="none",
      plot.title = element_text(size=11)
    ) +
    ggtitle("A boxplot with jitter") +
    xlab("")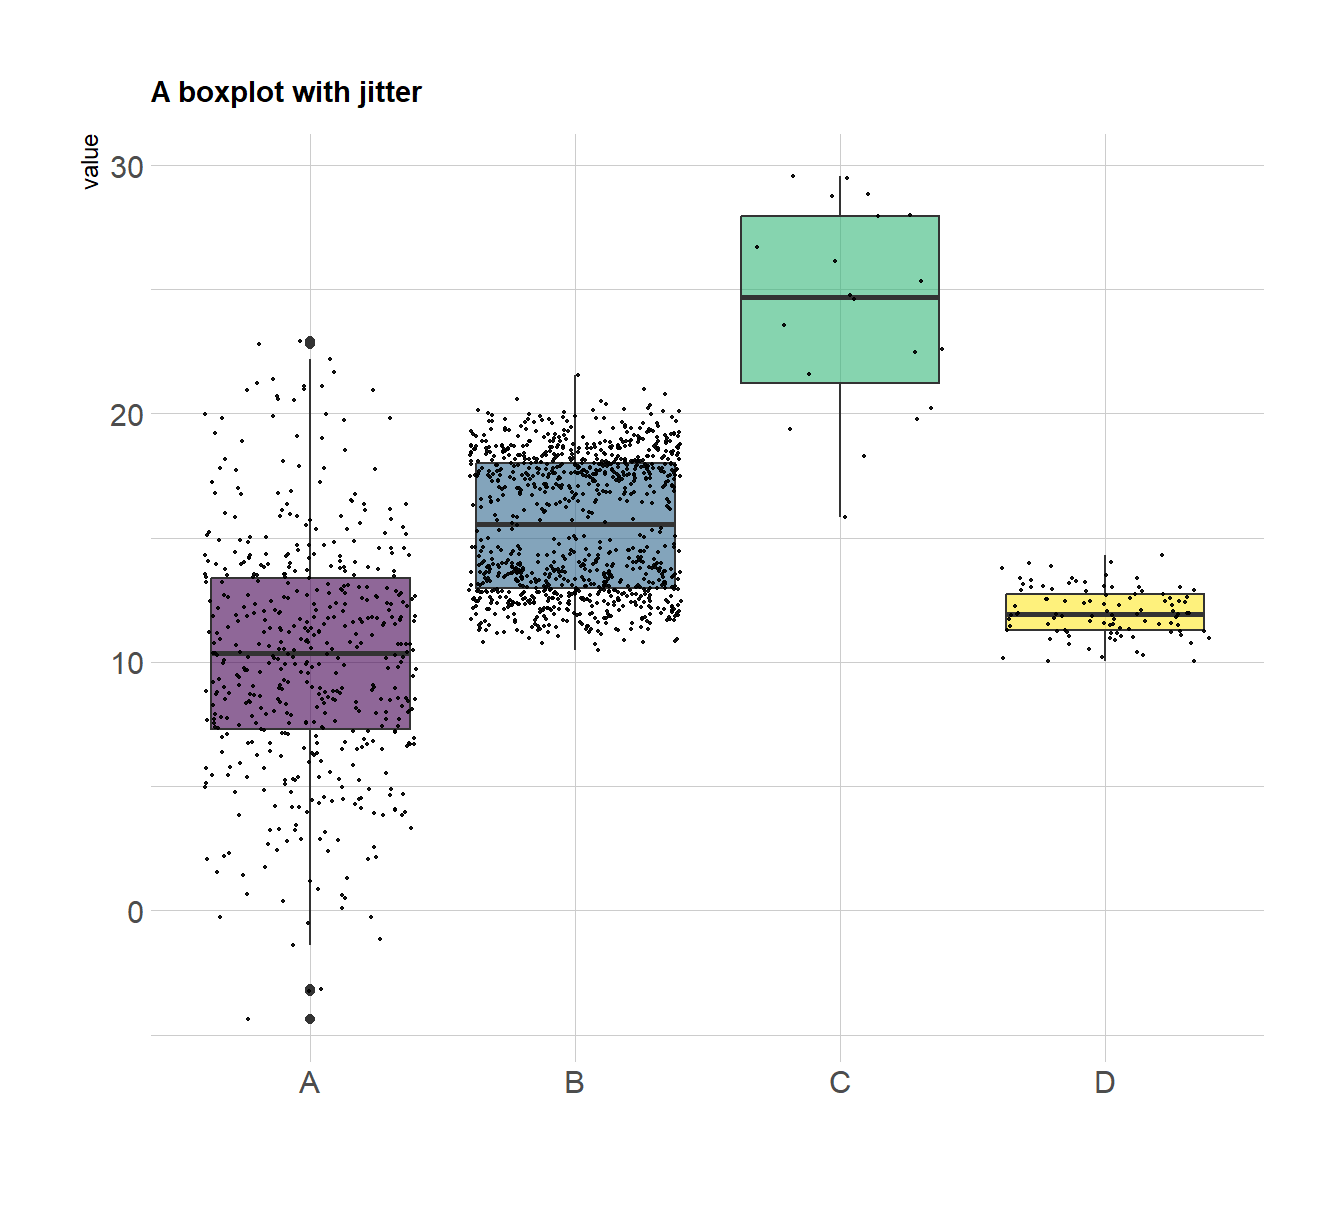
3.1.2 geom_boxplot()设置
# Dataset 1: one value per group
data <- data.frame(
  name=c("north","south","south-east","north-west","south-west","north-east","west","east"),
  val=sample(seq(1,10), 8 )
)

# Dataset 2: several values per group (natively provided in R)
# mpg

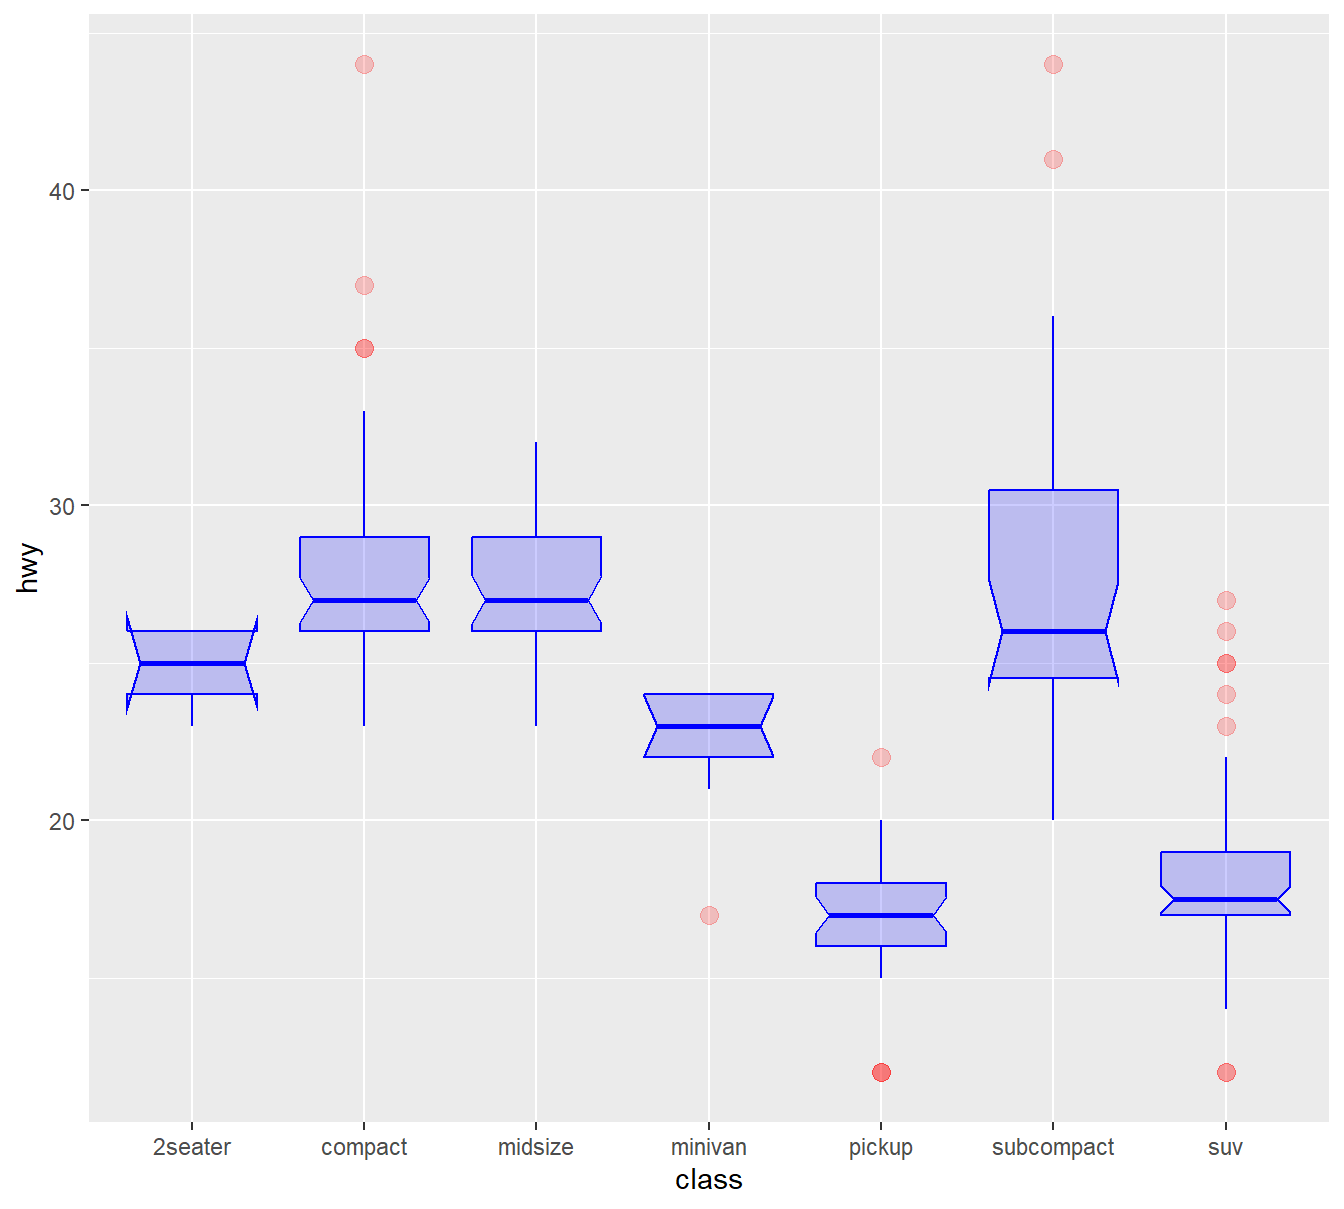
ggplot(mpg, aes(x=class, y=hwy)) +
    geom_boxplot(

        # custom boxes
        color="blue",
        fill="blue",
        alpha=0.2,

        # Notch?
        notch=TRUE,
        notchwidth = 0.8,

        # custom outliers
        outlier.colour="red",
        outlier.fill="red",
        outlier.size=3

    )
3.1.3 顺序 order (forcats包)
# load the library
library(forcats)

# Reorder following the value of another column:
data %>%
  mutate(name = fct_reorder(name, val)) %>%
  ggplot( aes(x=name, y=val)) +
    geom_bar(stat="identity", fill="#f68060", alpha=.6, width=.4) +
    coord_flip() +
    xlab("") +
    theme_bw()-> p1

# Reverse side
data %>%
  mutate(name = fct_reorder(name, desc(val))) %>%
  ggplot( aes(x=name, y=val)) +
    geom_bar(stat="identity", fill="#f68060", alpha=.6, width=.4) +
    coord_flip() +
    xlab("") +
    theme_bw()-> p2

ggarrange(p1,p2,labels=c("p1","p2"))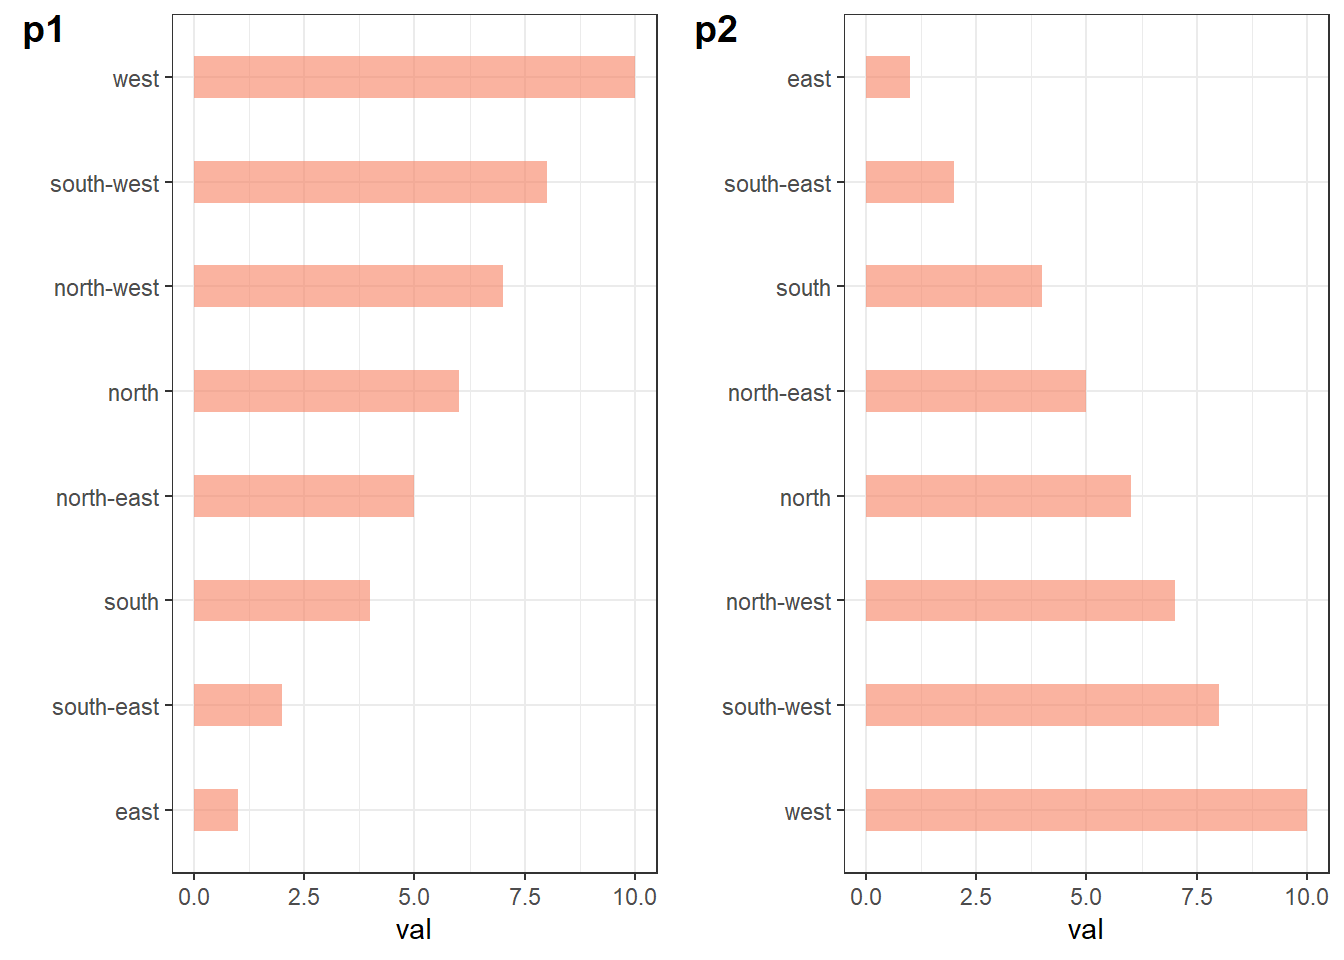
# Using median
mpg %>%
  mutate(class = fct_reorder(class, hwy, .fun='median')) %>%
  ggplot( aes(x=reorder(class, hwy), y=hwy, fill=class)) +
    geom_boxplot() +
    xlab("class") +
    theme(legend.position="none") +
    xlab("") -> p3

# Using number of observation per group
mpg %>%
  mutate(class = fct_reorder(class, hwy, .fun='length' )) %>%
  ggplot( aes(x=class, y=hwy, fill=class)) +
    geom_boxplot() +
    xlab("class") +
    theme(legend.position="none") +
    xlab("") +
    xlab("") -> p4
ggarrange(p3,p4,labels=c("p3","p4"))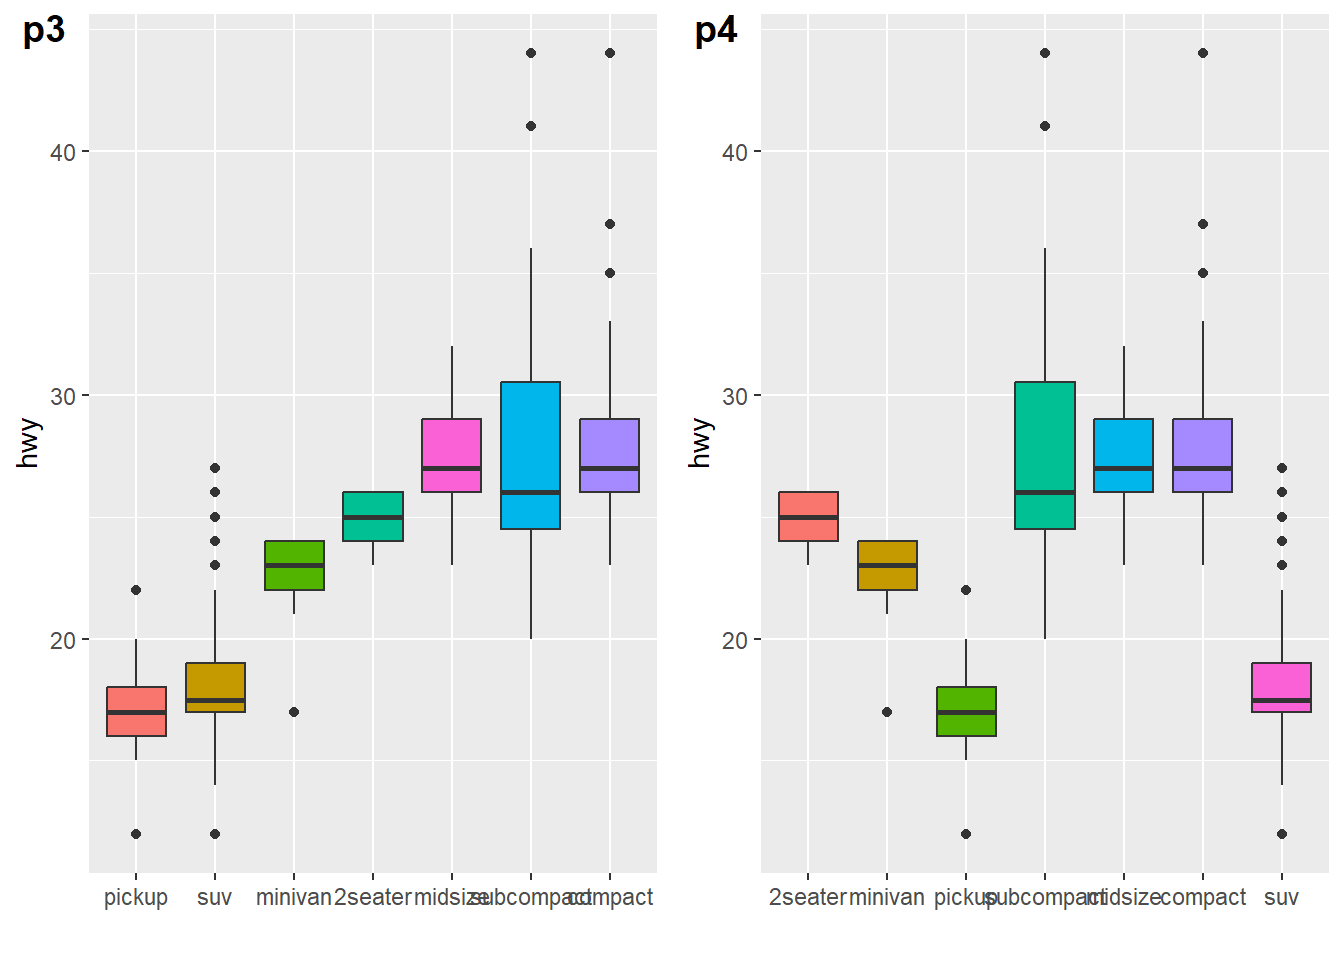
3.1.4 配色 (RcolorBrewer包)
# Top Left: Set a unique color with fill, colour, and alpha
ggplot(mpg, aes(x=class, y=hwy)) +
    geom_boxplot(color="red", fill="orange", alpha=0.2) -> p1

# Top Right: Set a different color for each group
ggplot(mpg, aes(x=class, y=hwy, fill=class)) +
    geom_boxplot(alpha=0.3) +
    theme(legend.position="none")-> p2

# Bottom Left
ggplot(mpg, aes(x=class, y=hwy, fill=class)) +
    geom_boxplot(alpha=0.3) +
    theme(legend.position="none") +
    scale_fill_brewer(palette="BuPu")-> p3

# Bottom Right
ggplot(mpg, aes(x=class, y=hwy, fill=class)) +
    geom_boxplot(alpha=0.3) +
    theme(legend.position="none") +
    scale_fill_brewer(palette="Dark2") -> p4
ggarrange(p1,p2,p3,p4,labels=c("p1","p2","p3","p4"))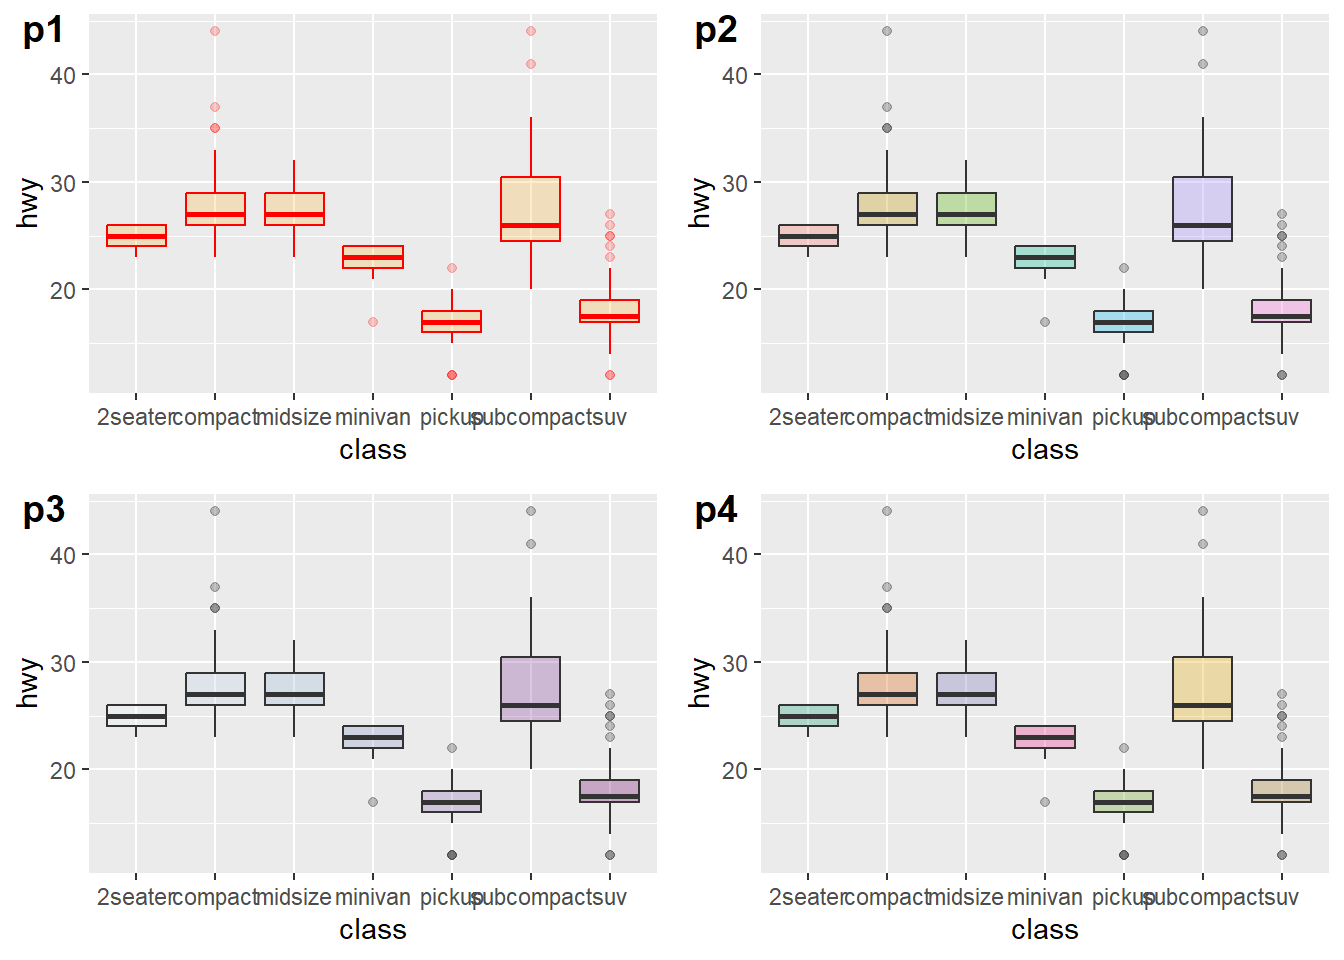
3.1.5 连续变量cut
diamonds %>%

  # Add a new column called 'bin': cut the initial 'carat' in bins
  mutate( bin=cut_width(carat, width=0.5, boundary=0) ) %>%

  # plot
  ggplot( aes(x=bin, y=price) ) +
    geom_boxplot(fill="#69b3a2") +
    theme_ipsum() +
    xlab("Carat")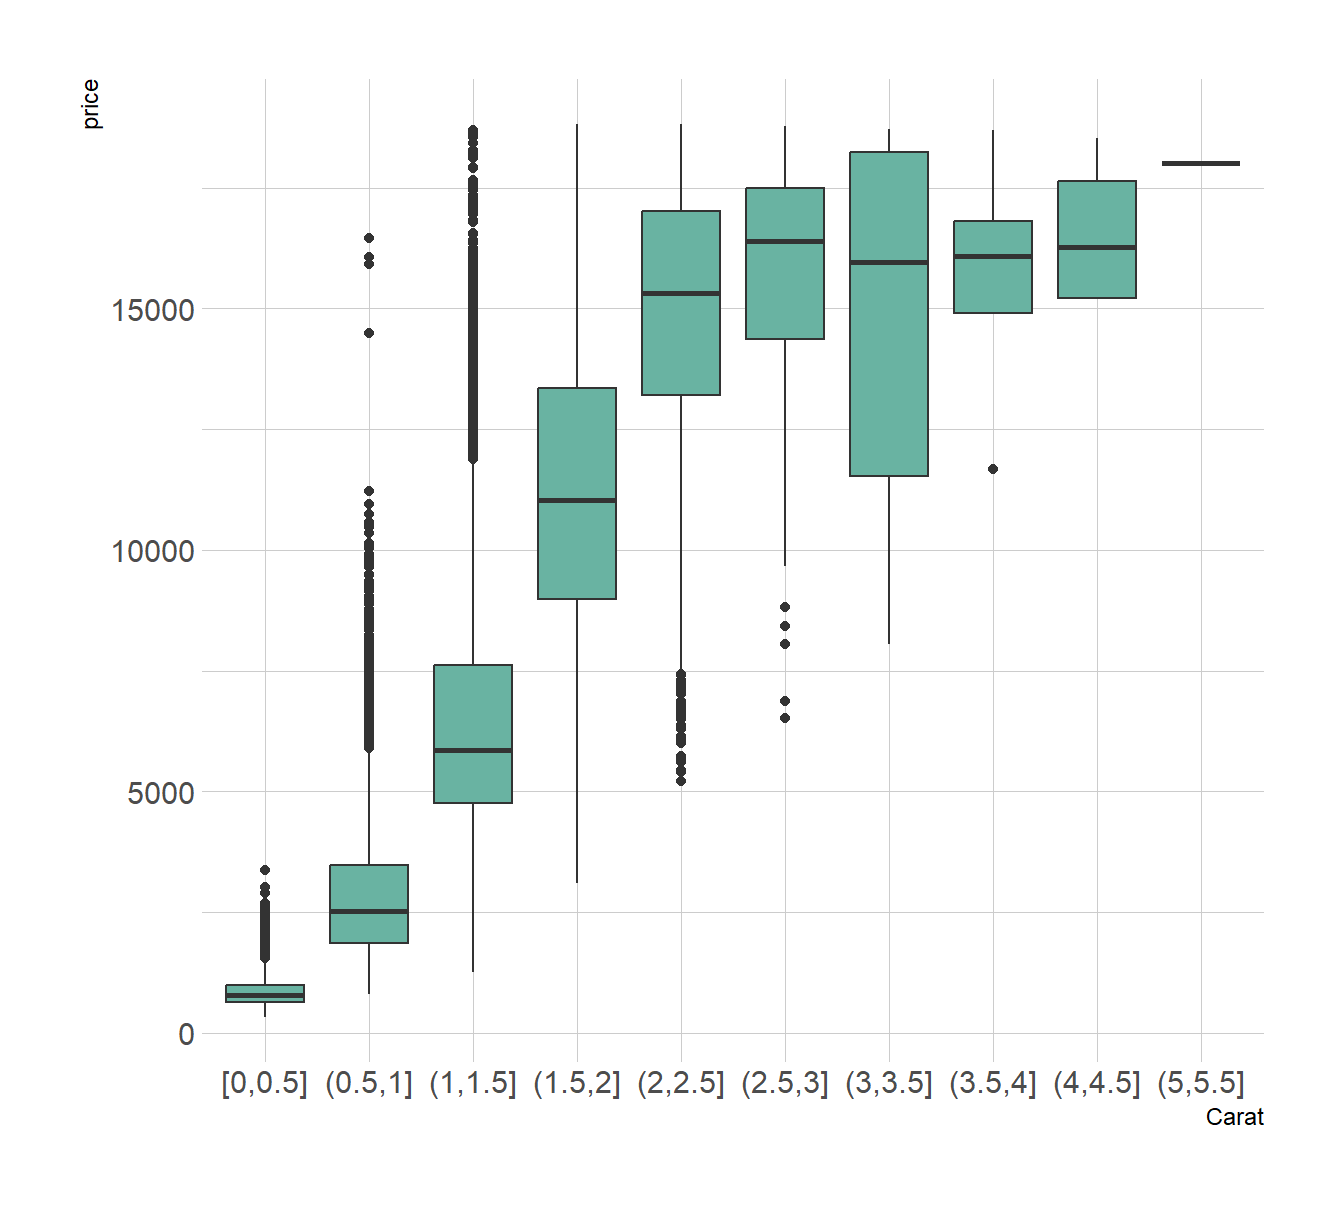
3.1.6 箱型图添加均值
names <- c(rep("A", 20) , rep("B", 5) , rep("C", 30), rep("D", 100))
value <- c( sample(2:5, 20 , replace=T) , sample(4:10, 5 , replace=T), sample(1:7, 30 , replace=T), sample(3:8, 100 , replace=T) )
data1 <- data.frame(names,value)


# plot
ggplot(data1, aes(x=names, y=value, fill=names)) +
    geom_boxplot(alpha=0.7) +
    stat_summary(fun.y=mean, geom="point", shape=20, size=14, color="red", fill="red") +
    theme(legend.position="none") +
    scale_fill_brewer(palette="Set1")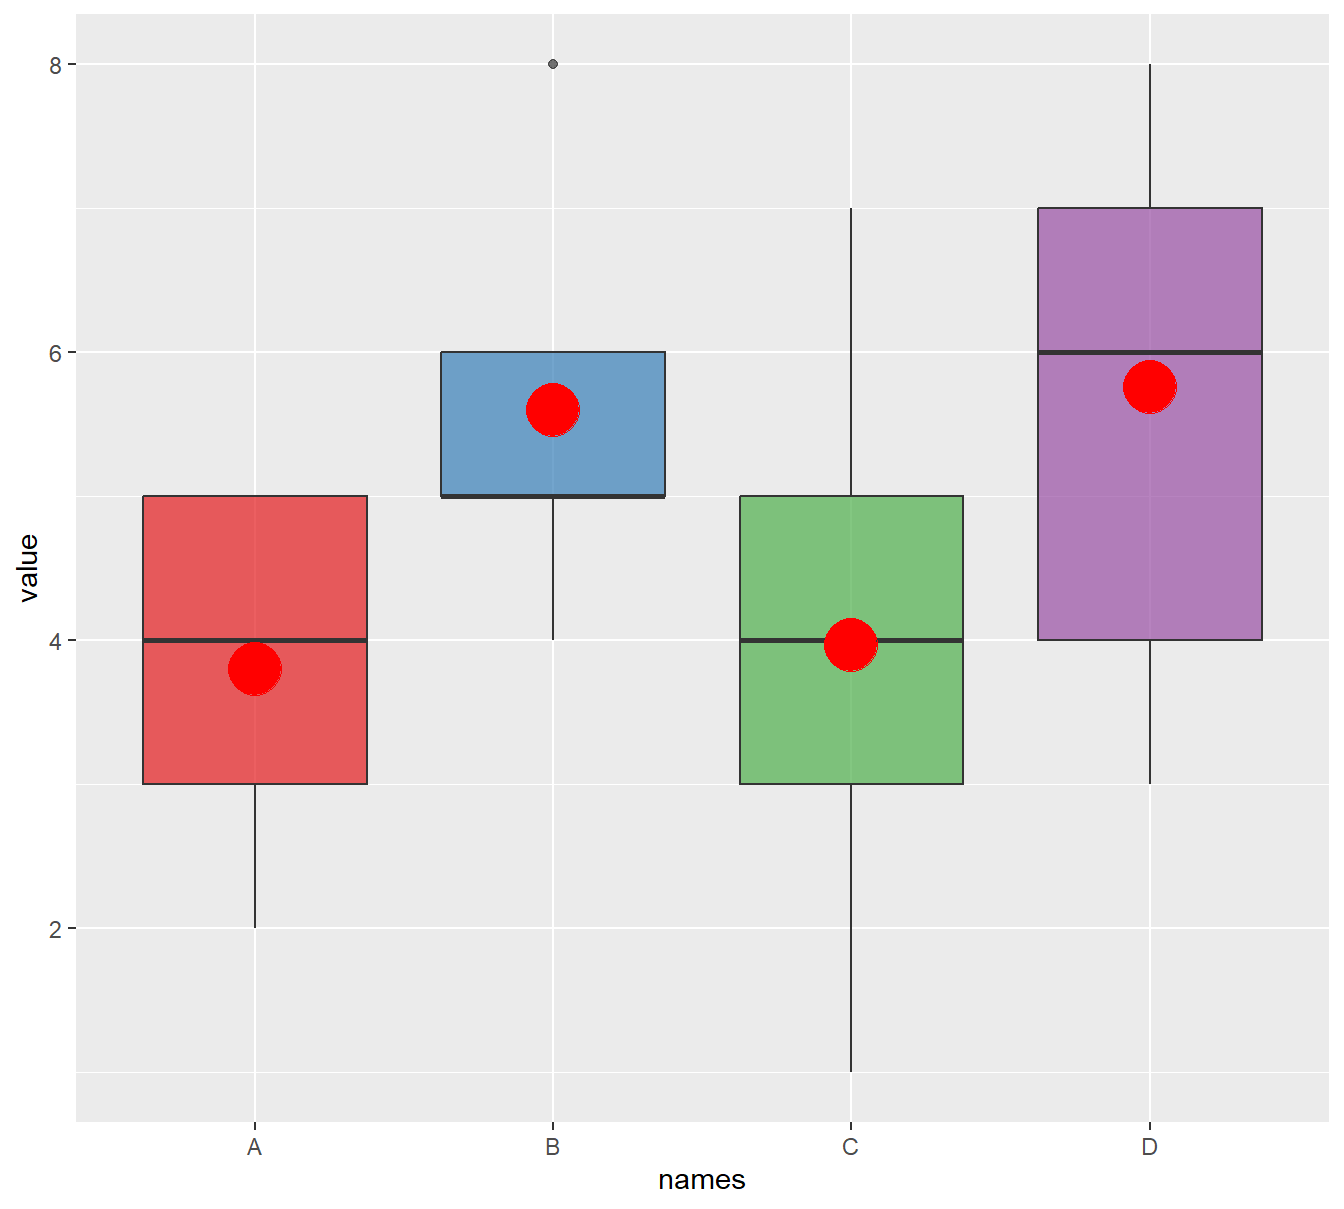
3.1.7 箱宽度
# prepare a special xlab with the number of obs for each group
my_xlab <- paste(levels(data1$names),"\n(N=",table(data1$names),")",sep="")

# plot
ggplot(data1, aes(x=names, y=value, fill=names)) +
    geom_boxplot(varwidth = TRUE, alpha=0.2) +
    theme(legend.position="none") +
    scale_x_discrete(labels=my_xlab)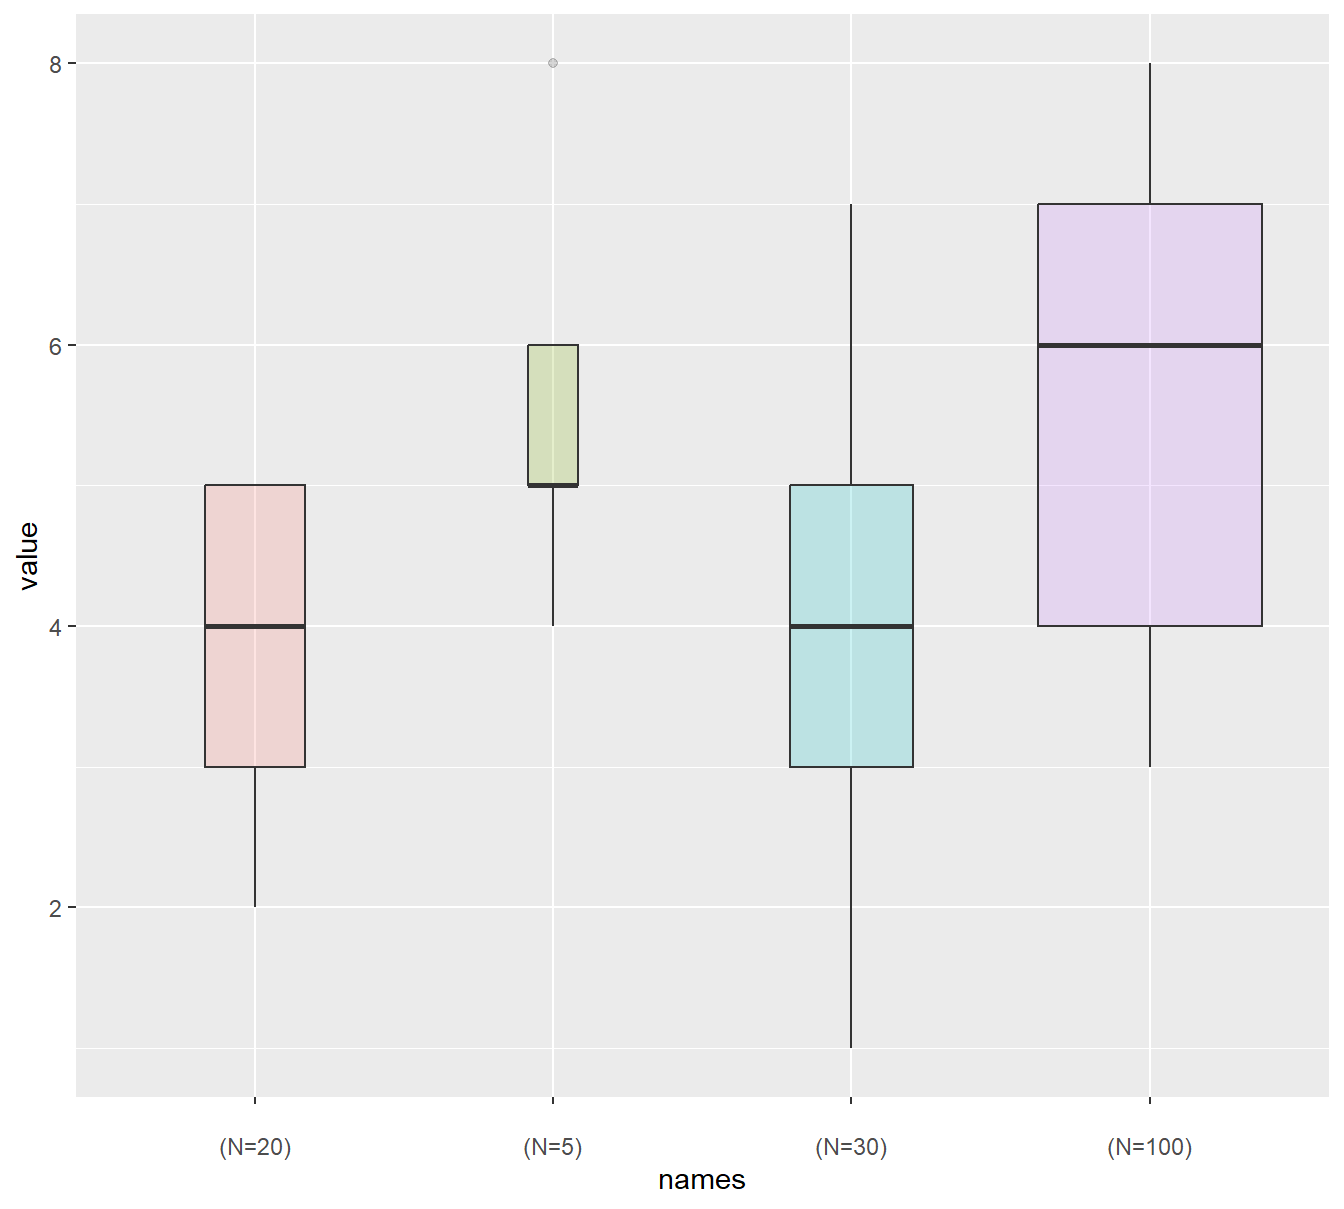
3.1.8 高亮分组 (RcolorBrewer包)
mpg %>%
  # Add a column called 'type': do we want to highlight the group or not?
  mutate( type=ifelse(class=="subcompact","Highlighted","Normal")) %>%

  # Build the boxplot. In the 'fill' argument, give this column
  ggplot( aes(x=class, y=hwy, fill=type, alpha=type)) +
    geom_boxplot() +
    scale_fill_manual(values=c("#69b3a2", "grey")) +
    scale_alpha_manual(values=c(1,0.1)) +
    theme_ipsum() +
    theme(legend.position = "none") +
    xlab("")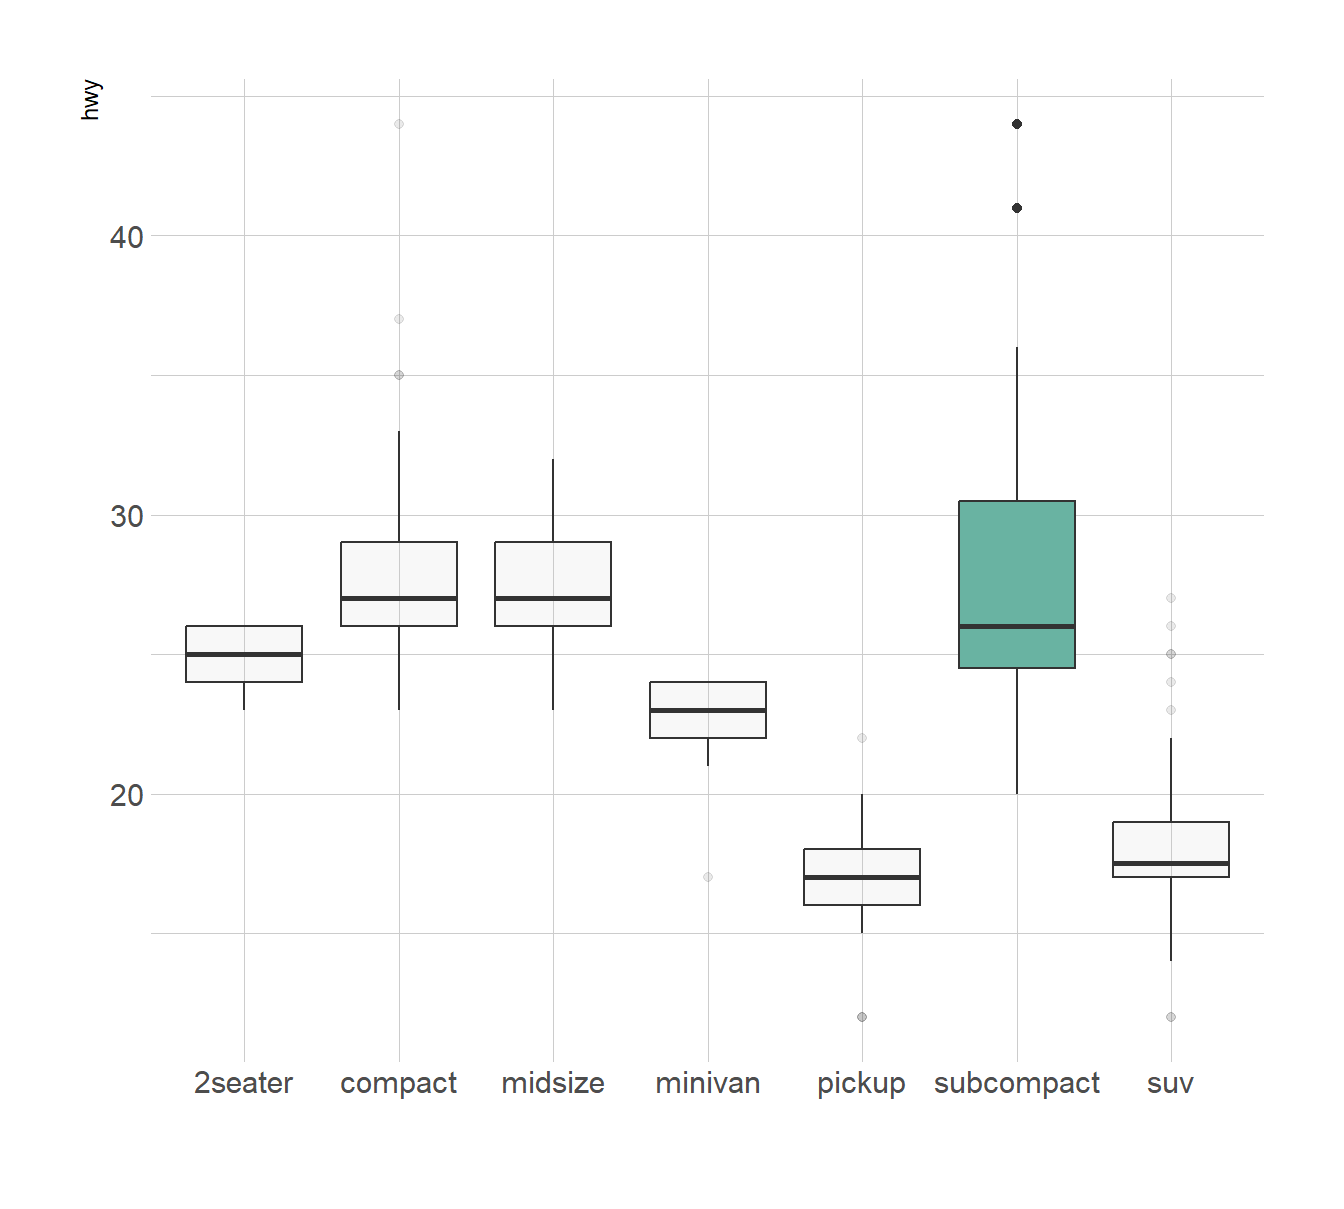
3.2 分组箱型图
# dataset
variety <- rep(LETTERS[1:7], each=40)
treatment <- rep(c("high","low"),each=20)
note <- seq(1:280)+sample(1:150, 280, replace=T)
data2 <- data.frame(variety, treatment ,  note)

# grouped boxplot
ggplot(data2, aes(x=variety, y=note, fill=treatment)) +
    geom_boxplot()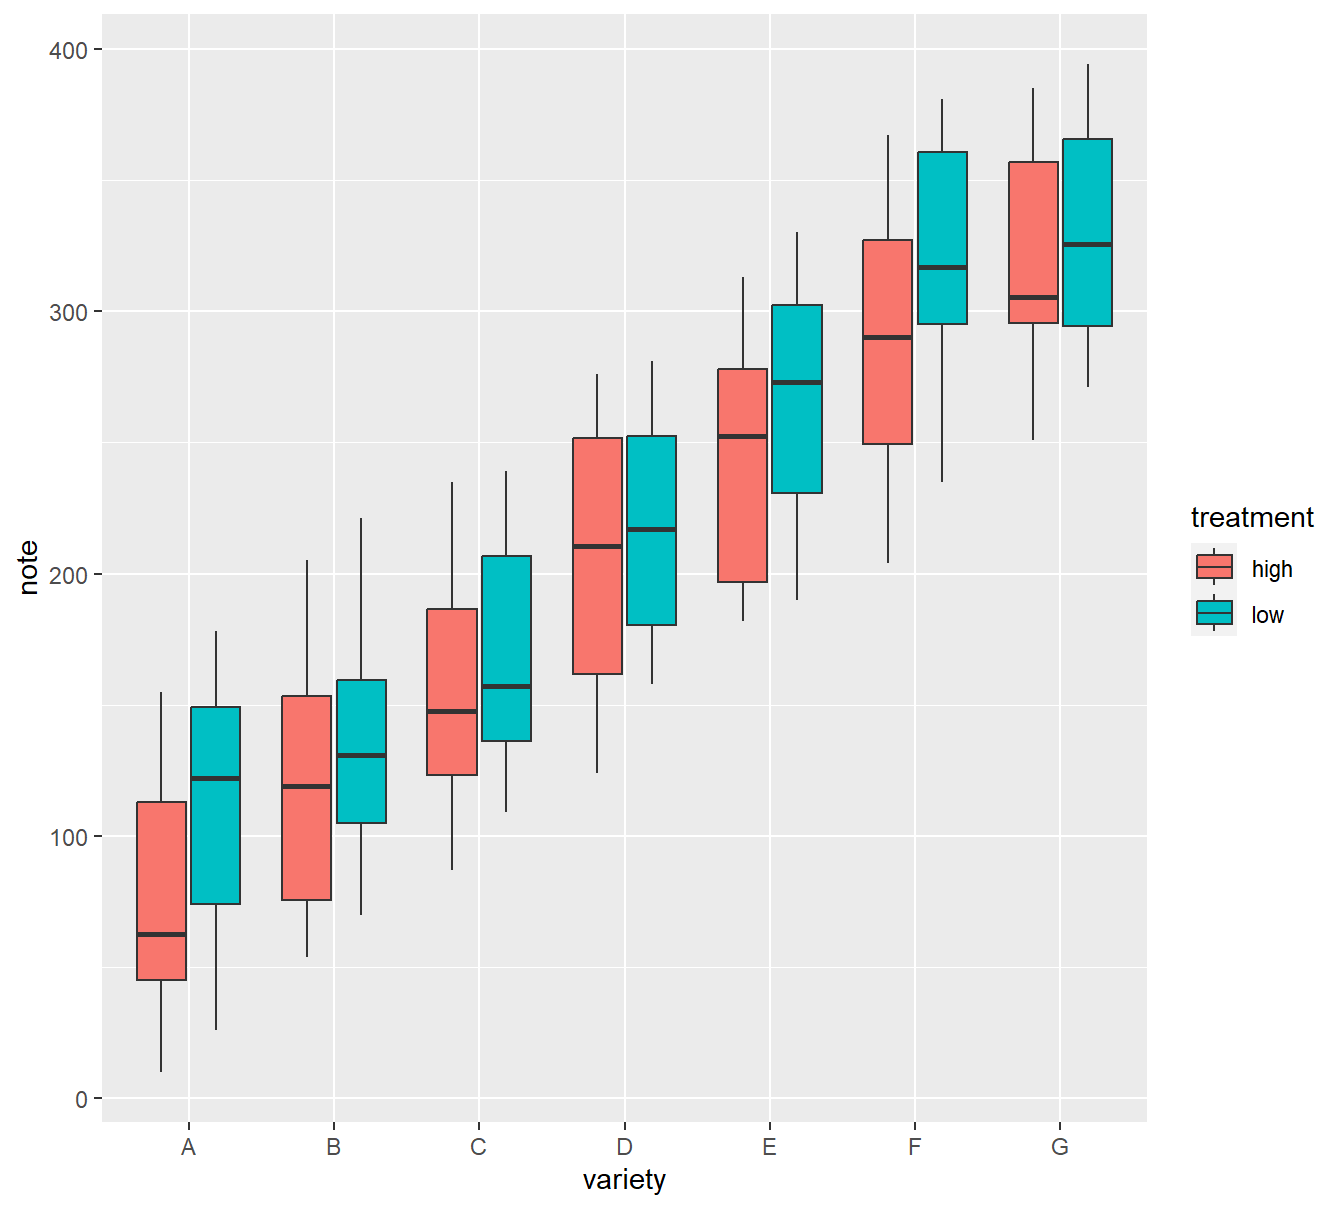
3.3 分面箱型图
# One box per treatment
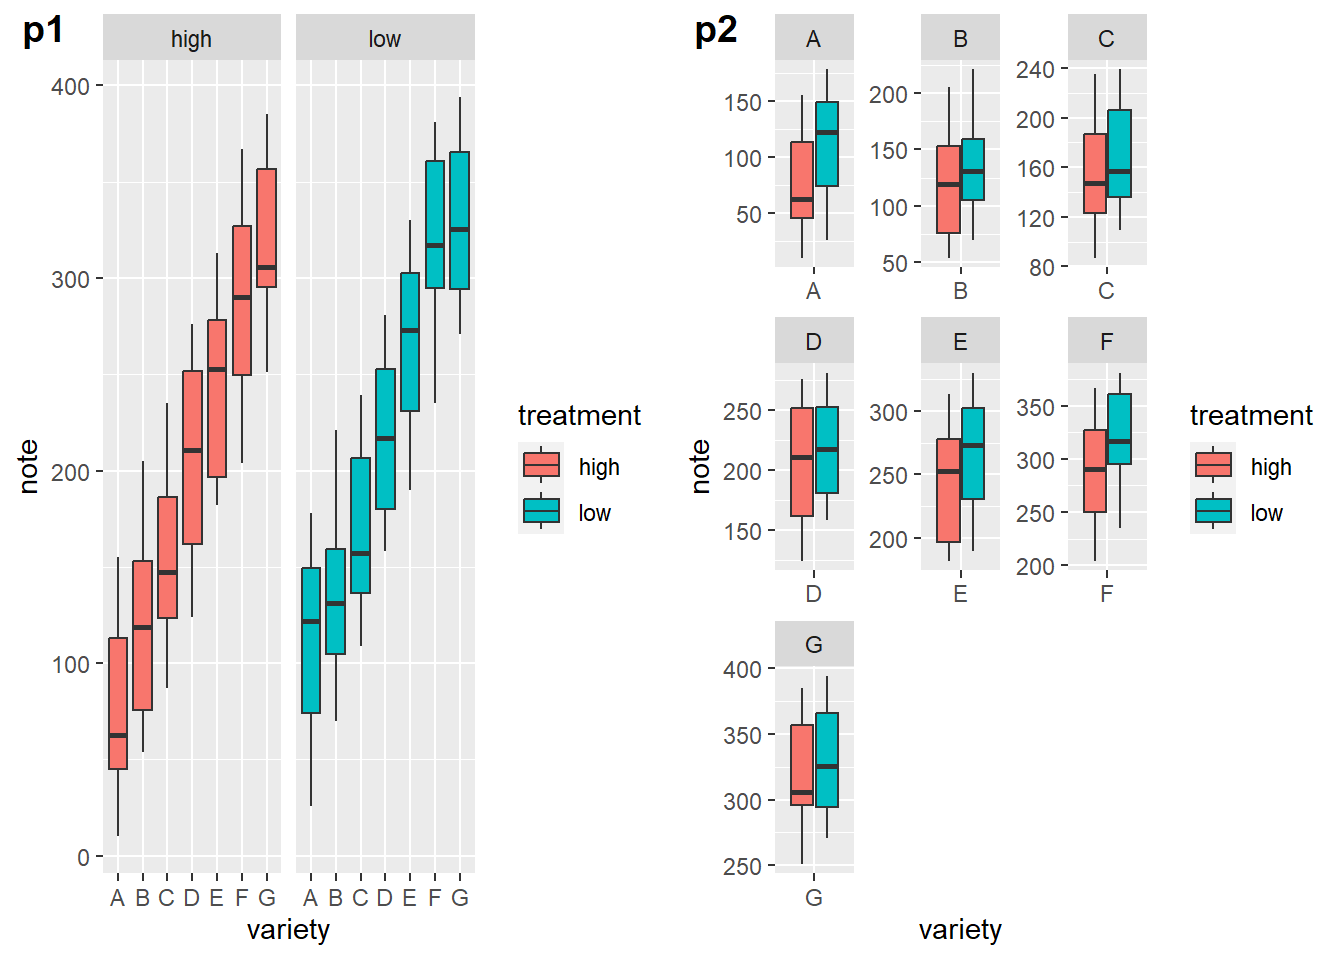
p1 <- ggplot(data2, aes(x=variety, y=note, fill=treatment)) +
    geom_boxplot() +
    facet_wrap(~treatment)
# one box per variety
p2 <- ggplot(data2, aes(x=variety, y=note, fill=treatment)) +
    geom_boxplot() +
    facet_wrap(~variety, scale="free")
ggarrange(p1,p2,labels=c("p1","p2"))