第 7 章 线型图
7.1 基本线型图
xValue <- 1:10
yValue <- cumsum(rnorm(10))
data <- data.frame(xValue,yValue)

# Plot
ggplot(data, aes(x=xValue, y=yValue)) +
  geom_line()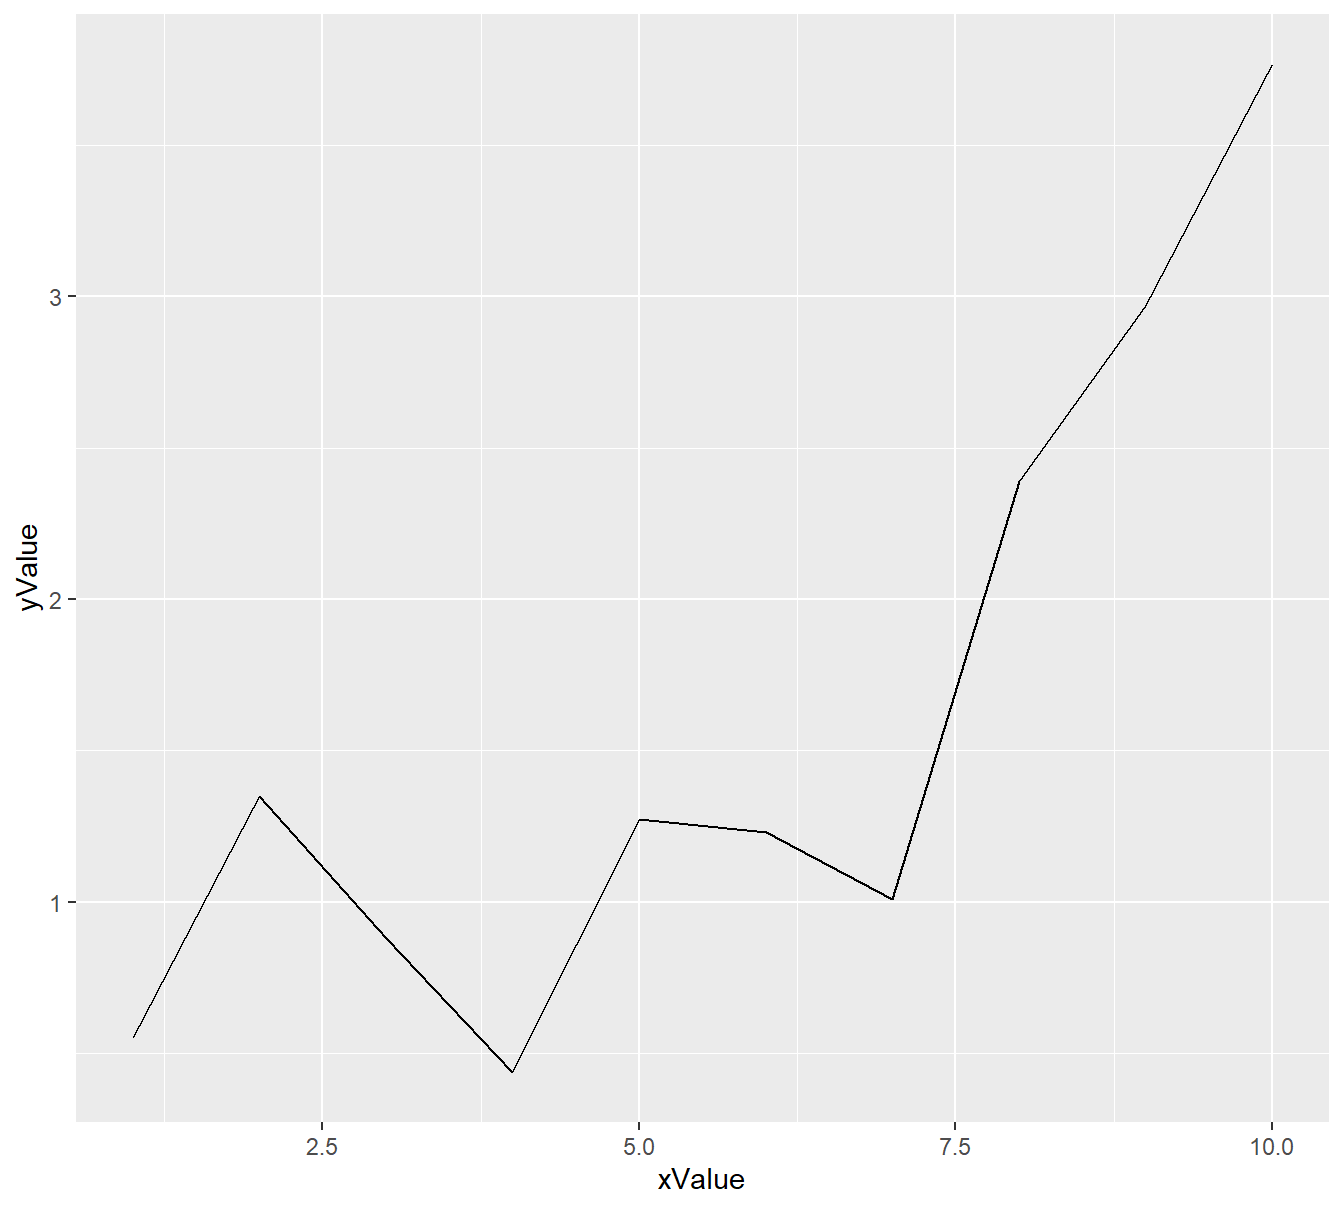
- 使用latticeExtra包
#library
library(latticeExtra)

# create data
set.seed(1)
x <- 1:100
var1 <- cumsum(rnorm(100))
var2 <- var1^2
data <- data.frame(x,var1,var2)


# --> construct separate plots for each series
obj1 <- xyplot(var1 ~ x, data, type = "l" , lwd=2, col="steelblue")
obj2 <- xyplot(var2 ~ x, data, type = "l", lwd=2, col="#69b3a2")

# --> Make the plot with second y axis AND legend:
doubleYScale(obj1, obj2, text = c("obj1", "obj2") , add.ylab2 = TRUE)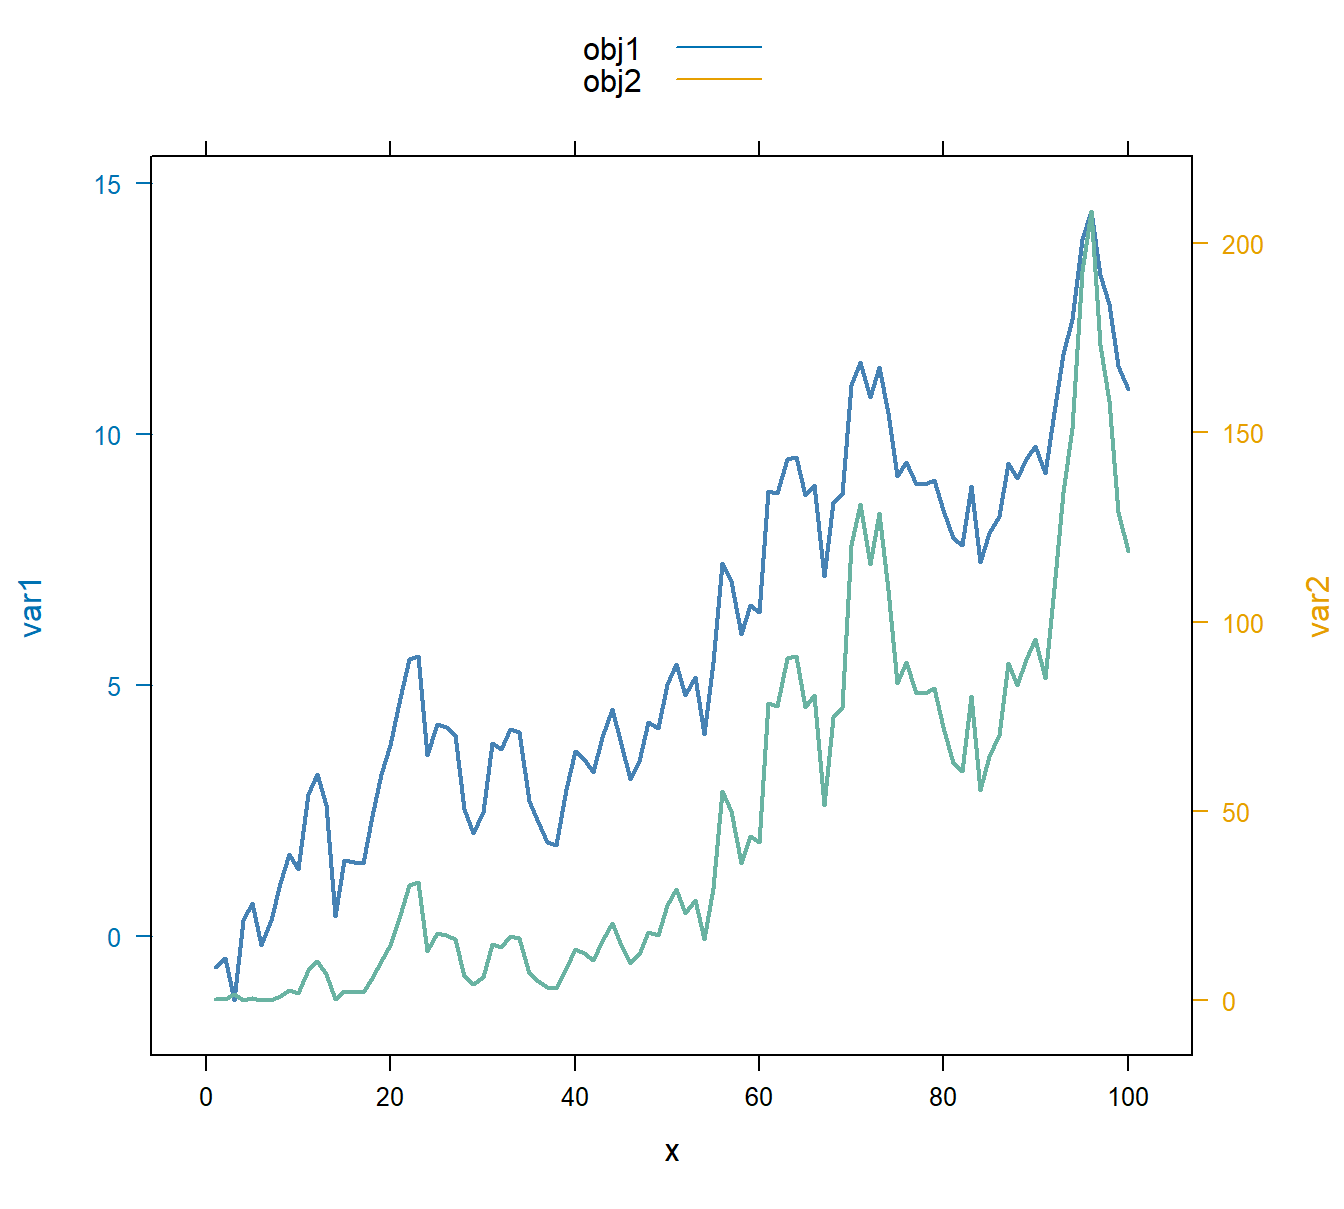
7.1.1 自定义样式
- linetype
xValue <- 1:10
yValue <- cumsum(rnorm(10))
data <- data.frame(xValue,yValue)

ggplot(data, aes(x=xValue, y=yValue)) +
  geom_line( color="#69b3a2", size=2, alpha=0.9, linetype=2) +
  theme_ipsum() +
  ggtitle("Line chart")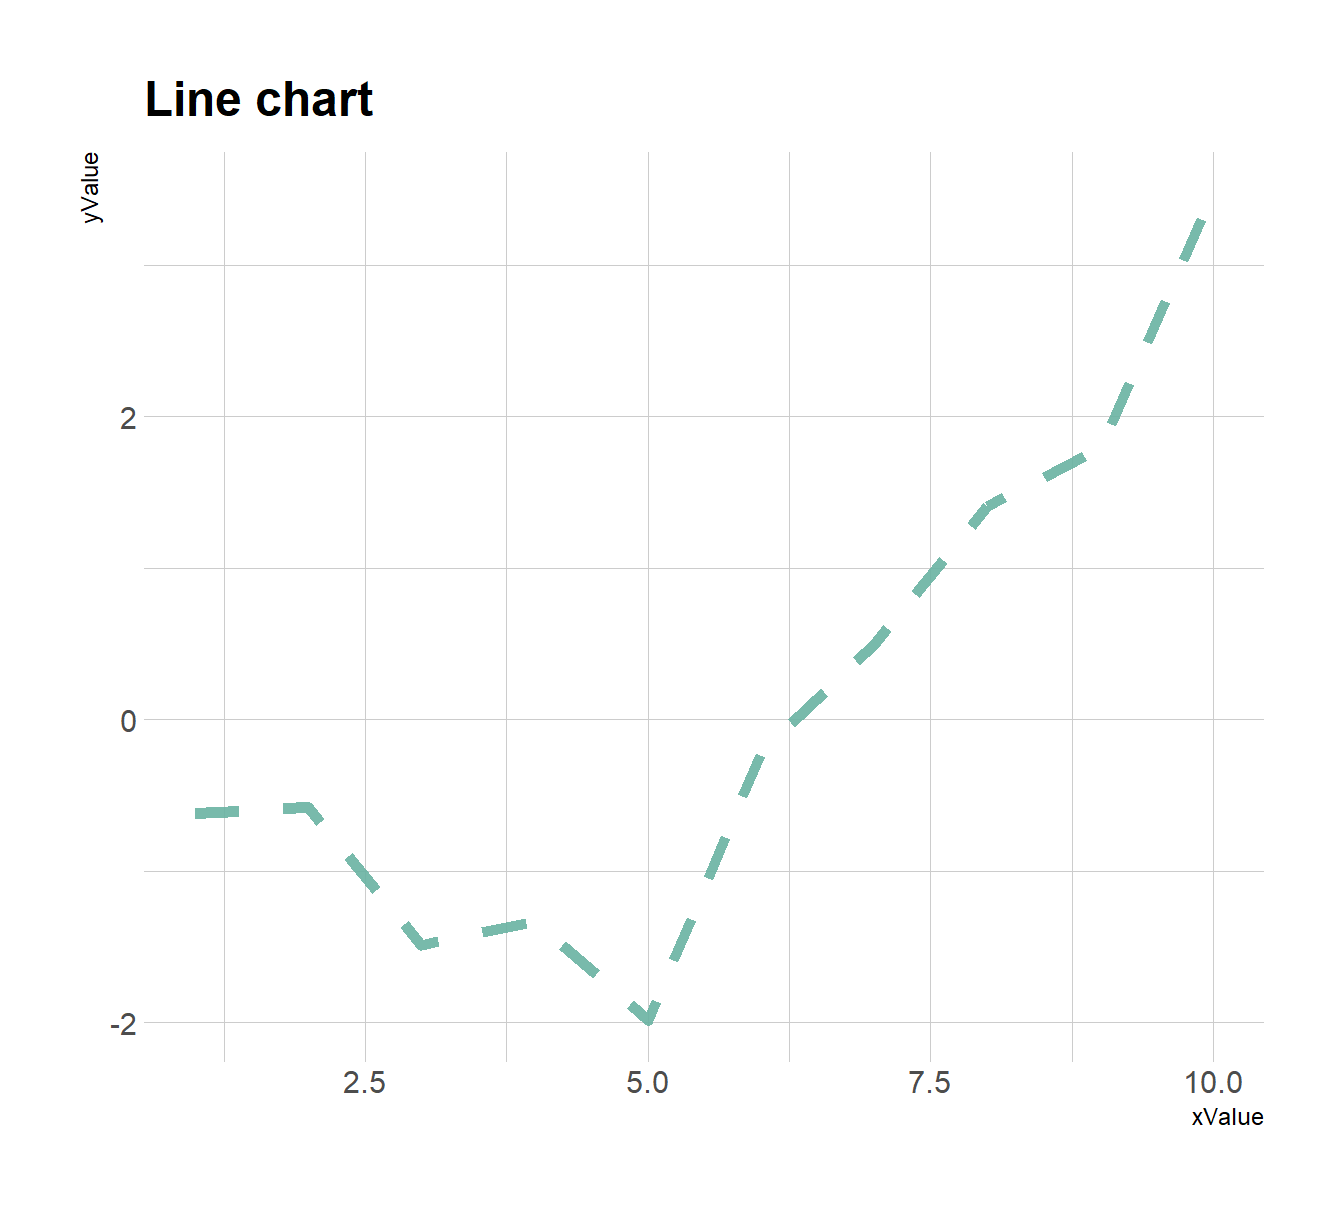
- log转换
data <- data.frame(
  x=seq(10,100),
  y=seq(10,100)/2+rnorm(90)
)

# Make the plot
p1 <- ggplot(data, aes(x=x, y=y)) +
  geom_line() +
  ggtitle("Without log transform")

# Make the plot

p2 <- ggplot(data, aes(x=x, y=y)) +
  geom_line() +
  scale_y_log10( breaks=c(1,5,10,15,20,50,100), limits=c(1,100) )+
  ggtitle("log transform")

ggarrange(p1,p2)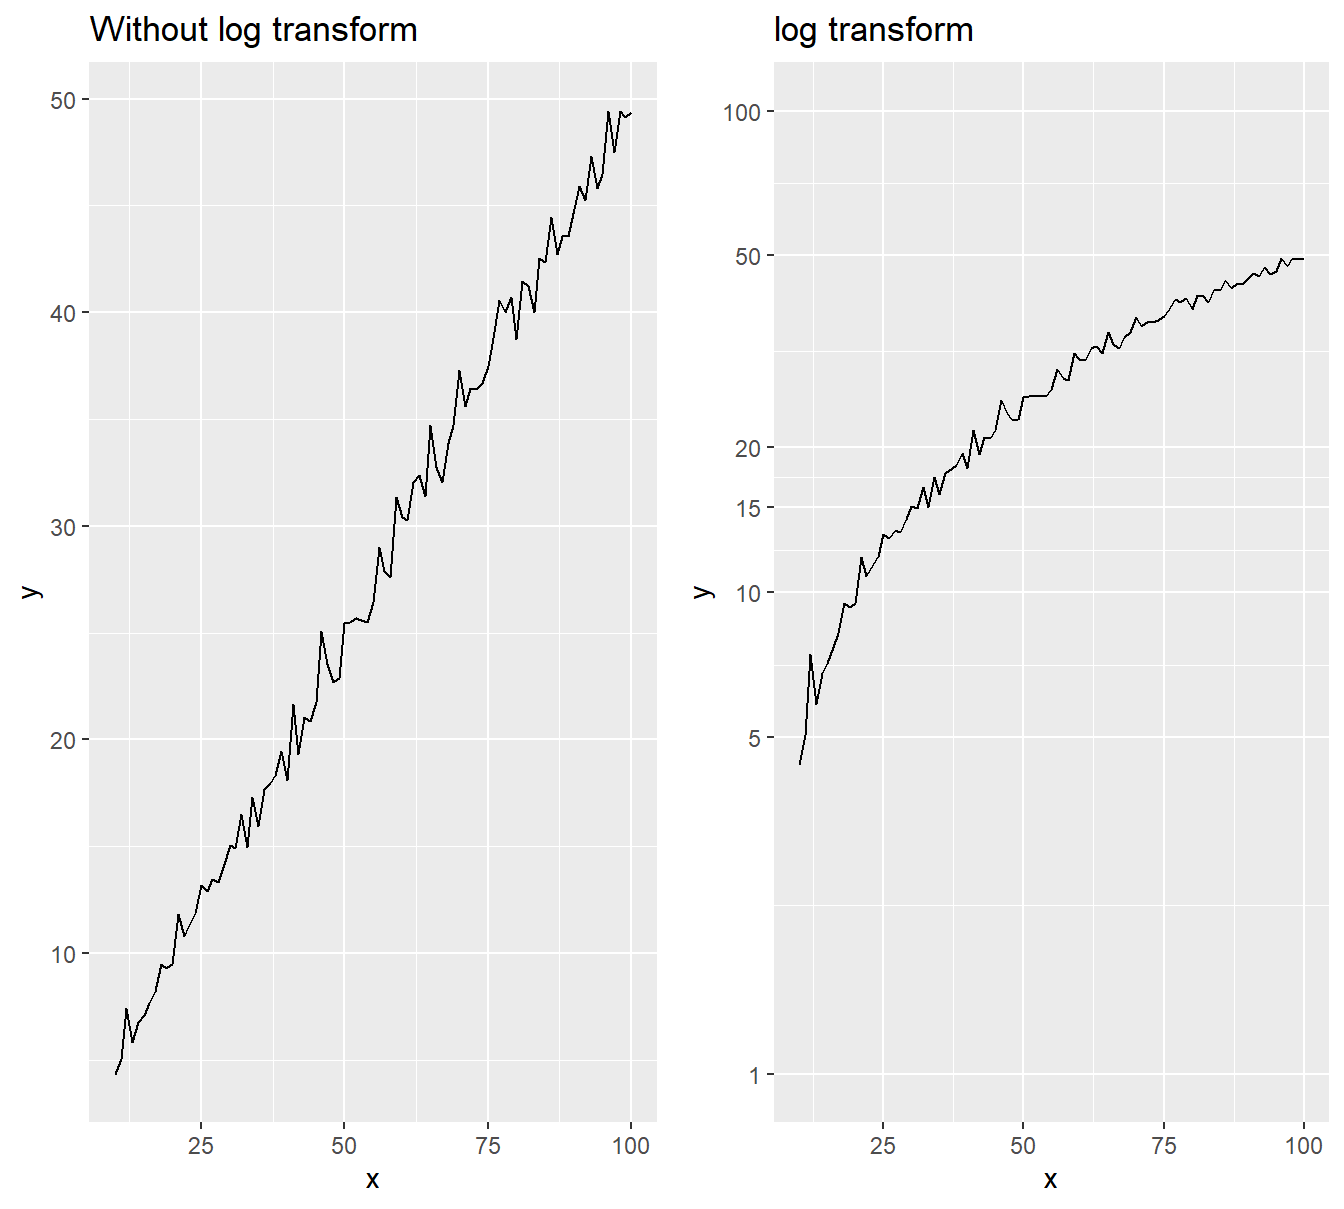
7.1.2 添加注释
data <- read.csv("Datas/3_TwoNumOrdered.csv")
data$date <- as.Date(data$date)

# plot
data %>%
  ggplot( aes(x=date, y=value)) +
    geom_line(color="#69b3a2") +
    ylim(0,22000) +
    annotate(geom="text", x=as.Date("2017-01-01"), y=20089,
             label="Bitcoin price reached 20k $\nat the end of 2017") +
    annotate(geom="point", x=as.Date("2017-12-17"), y=20089, size=10, shape=21, fill="transparent") +
    geom_hline(yintercept=5000, color="orange", size=.5) +
    theme_ipsum()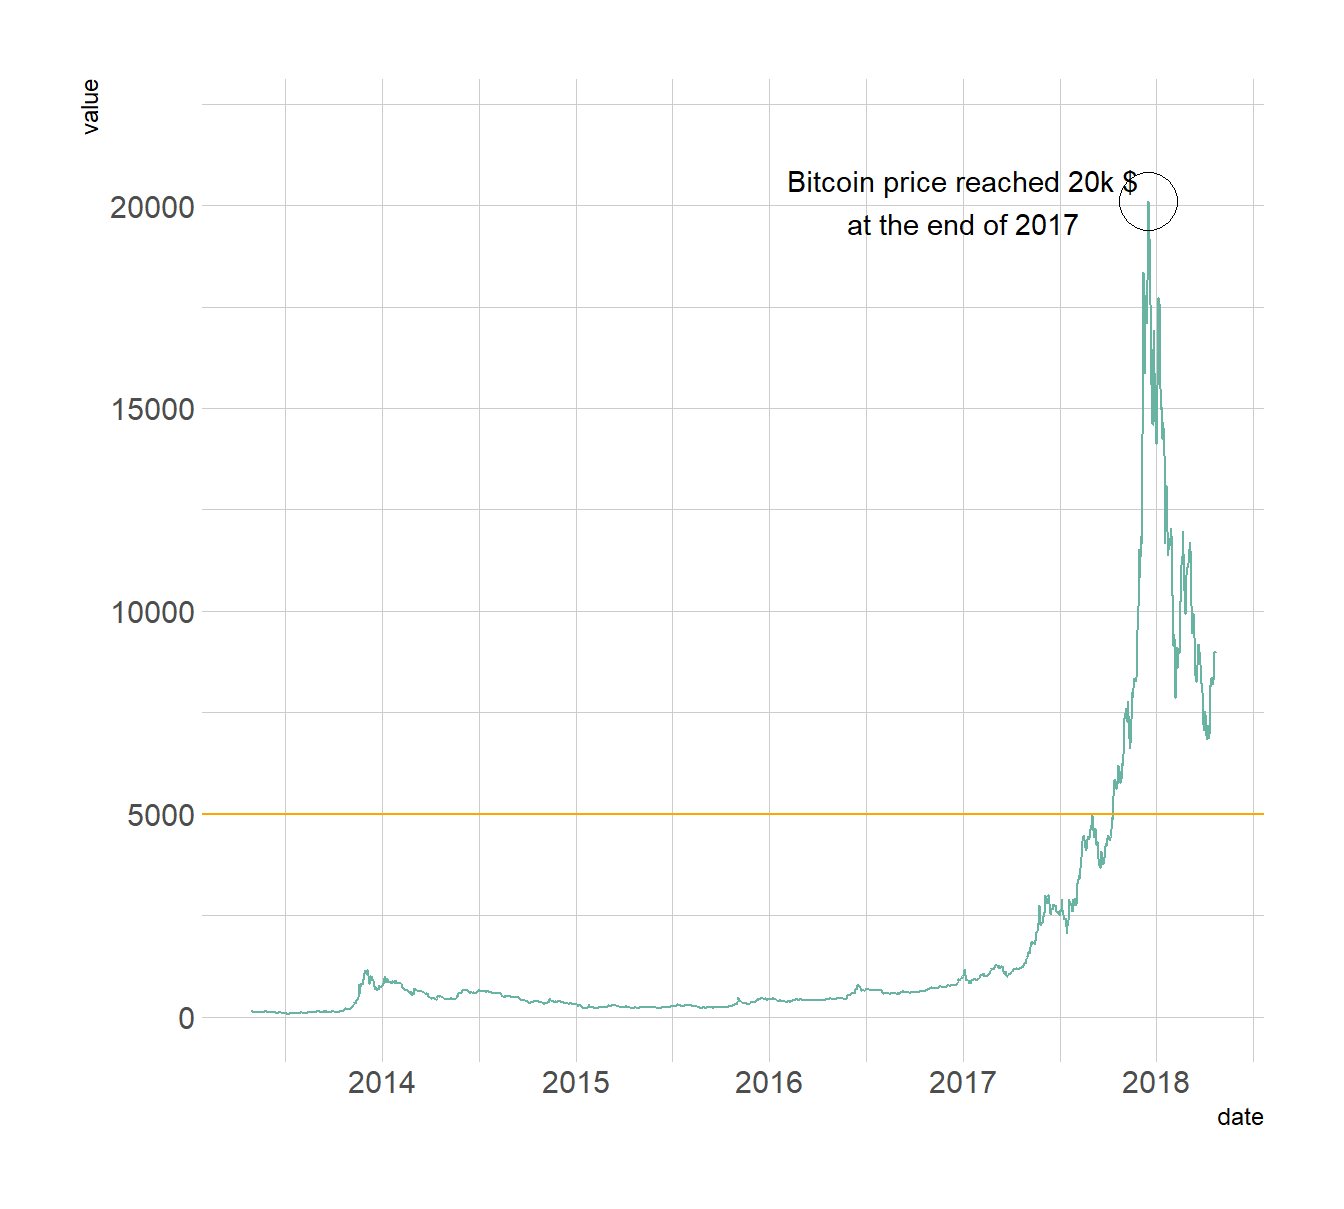
7.2 分组线型图
library(babynames) # provide the dataset: a dataframe called babynames
library(dplyr)

# Keep only 3 names
don <- babynames %>%
  filter(name %in% c("Ashley", "Patricia", "Helen")) %>%
  filter(sex=="F")

# Plot
don %>%
  ggplot( aes(x=year, y=n, group=name, color=name)) +
    geom_line()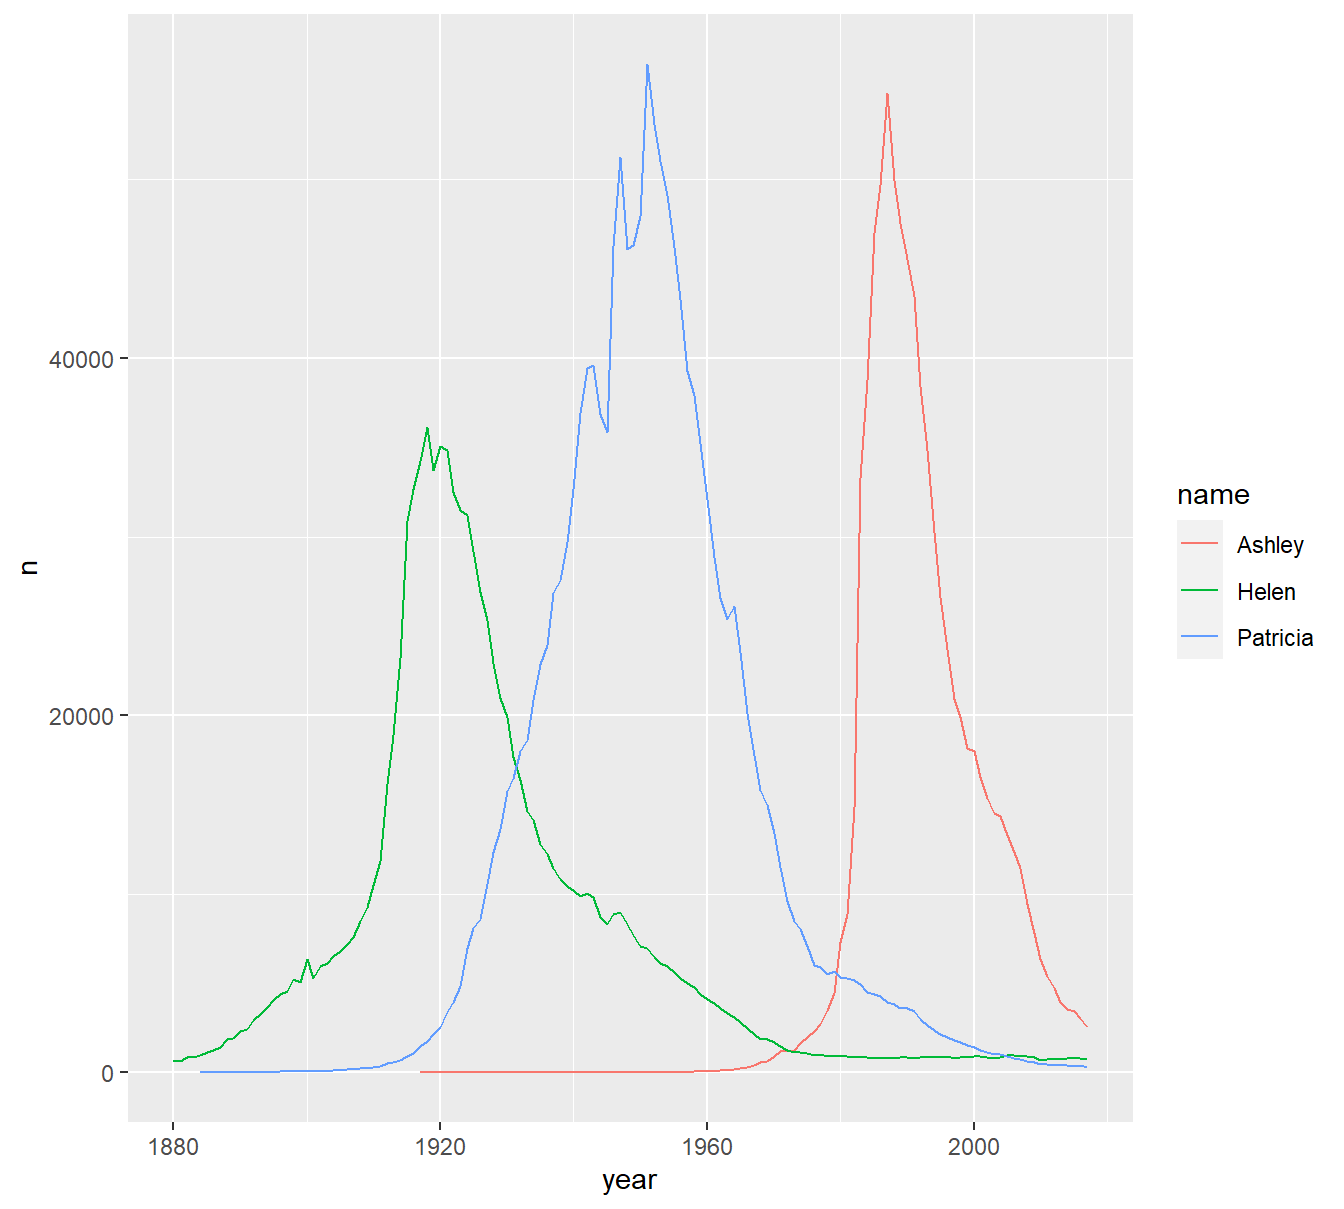
7.2.1 自定义样式
don <- babynames %>%
  filter(name %in% c("Ashley", "Patricia", "Helen")) %>%
  filter(sex=="F")

# Plot
don %>%
  ggplot( aes(x=year, y=n, group=name, color=name)) +
    geom_line() +
    scale_color_viridis(discrete = TRUE) +
    ggtitle("Popularity of American names in the previous 30 years") +
    theme_ipsum() +
    ylab("Number of babies born")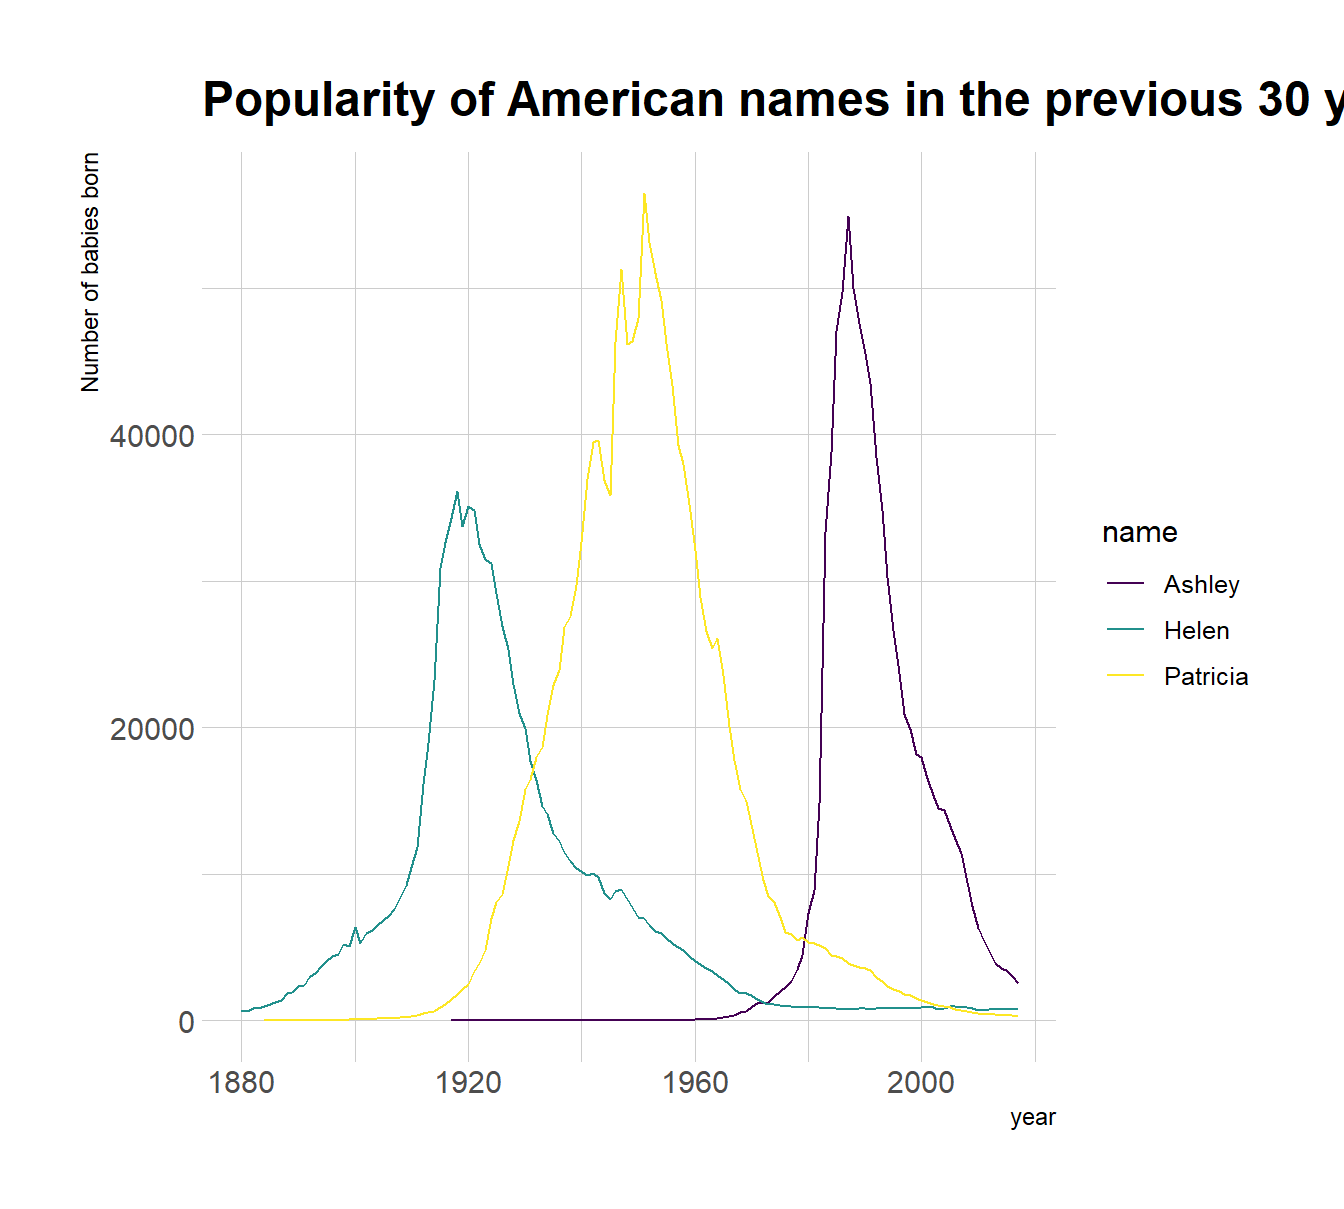
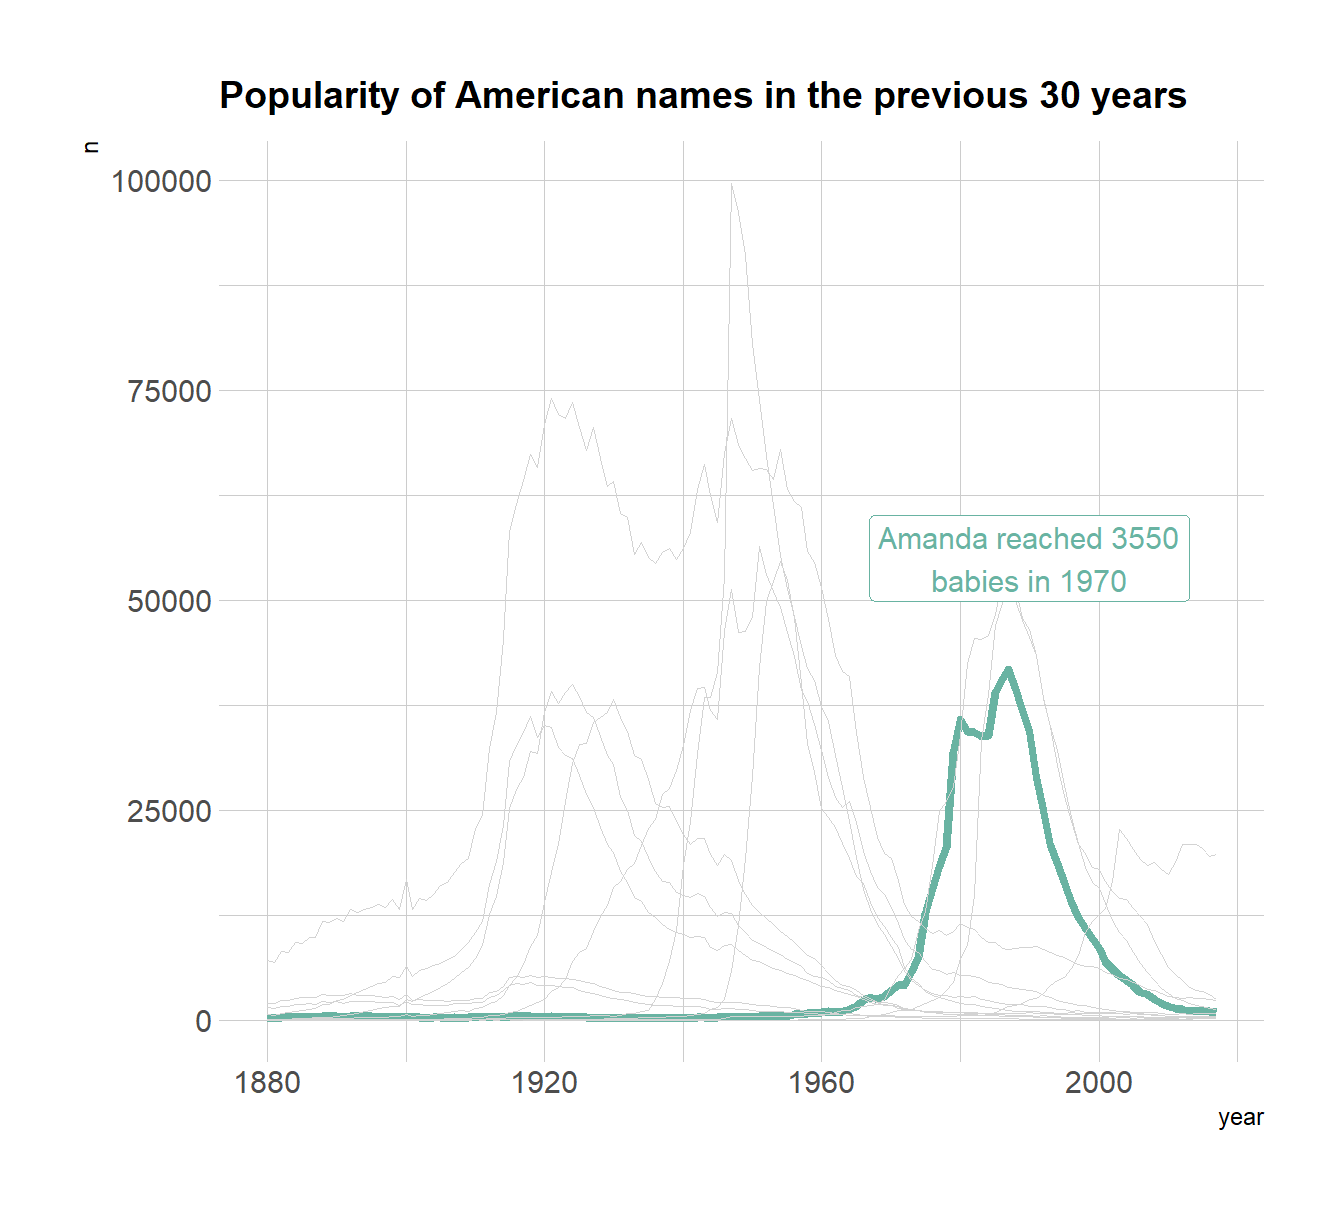
7.3 高亮分组
方法一:
library(babynames)
data <- babynames %>%
  filter(name %in% c("Mary","Emma", "Ida", "Ashley", "Amanda", "Jessica",    "Patricia", "Linda", "Deborah",   "Dorothy", "Betty", "Helen")) %>%
  filter(sex=="F")

data %>%
  mutate( highlight=ifelse(name=="Amanda", "Amanda", "Other")) %>%
  ggplot( aes(x=year, y=n, group=name, color=highlight, size=highlight)) +
    geom_line() +
    scale_color_manual(values = c("#69b3a2", "lightgrey")) +
    scale_size_manual(values=c(1.5,0.2)) +
    theme(legend.position="none") +
    ggtitle("Popularity of American names in the previous 30 years") +
    theme_ipsum() +
    geom_label( x=1990, y=55000, label="Amanda reached 3550\nbabies in 1970", size=4, color="#69b3a2") +
    theme(
      legend.position="none",
      plot.title = element_text(size=14)
)
方法二:gghighlight包
library(gghighlight)
set.seed(1)
period  <-  100
df <-  data.frame(Date = seq(as.Date("2020-01-01"),
                           by = "day",
                           length.out = period),
                Value = c(cumsum(rnorm(period)),
                          cumsum(rnorm(period)),
                          cumsum(rnorm(period))),
                Type = c(rep("a", period),
                         rep("b", period),
                         rep("c", period)))

ggplot(df) +
  geom_line(aes(Date, Value, colour = Type), linewidth=1) +
  gghighlight(max(Value) > 10,
              unhighlighted_params = list(linewidth = 0.3,
                                          colour = alpha("blue", 0.7),
                                          linetype = "dashed"))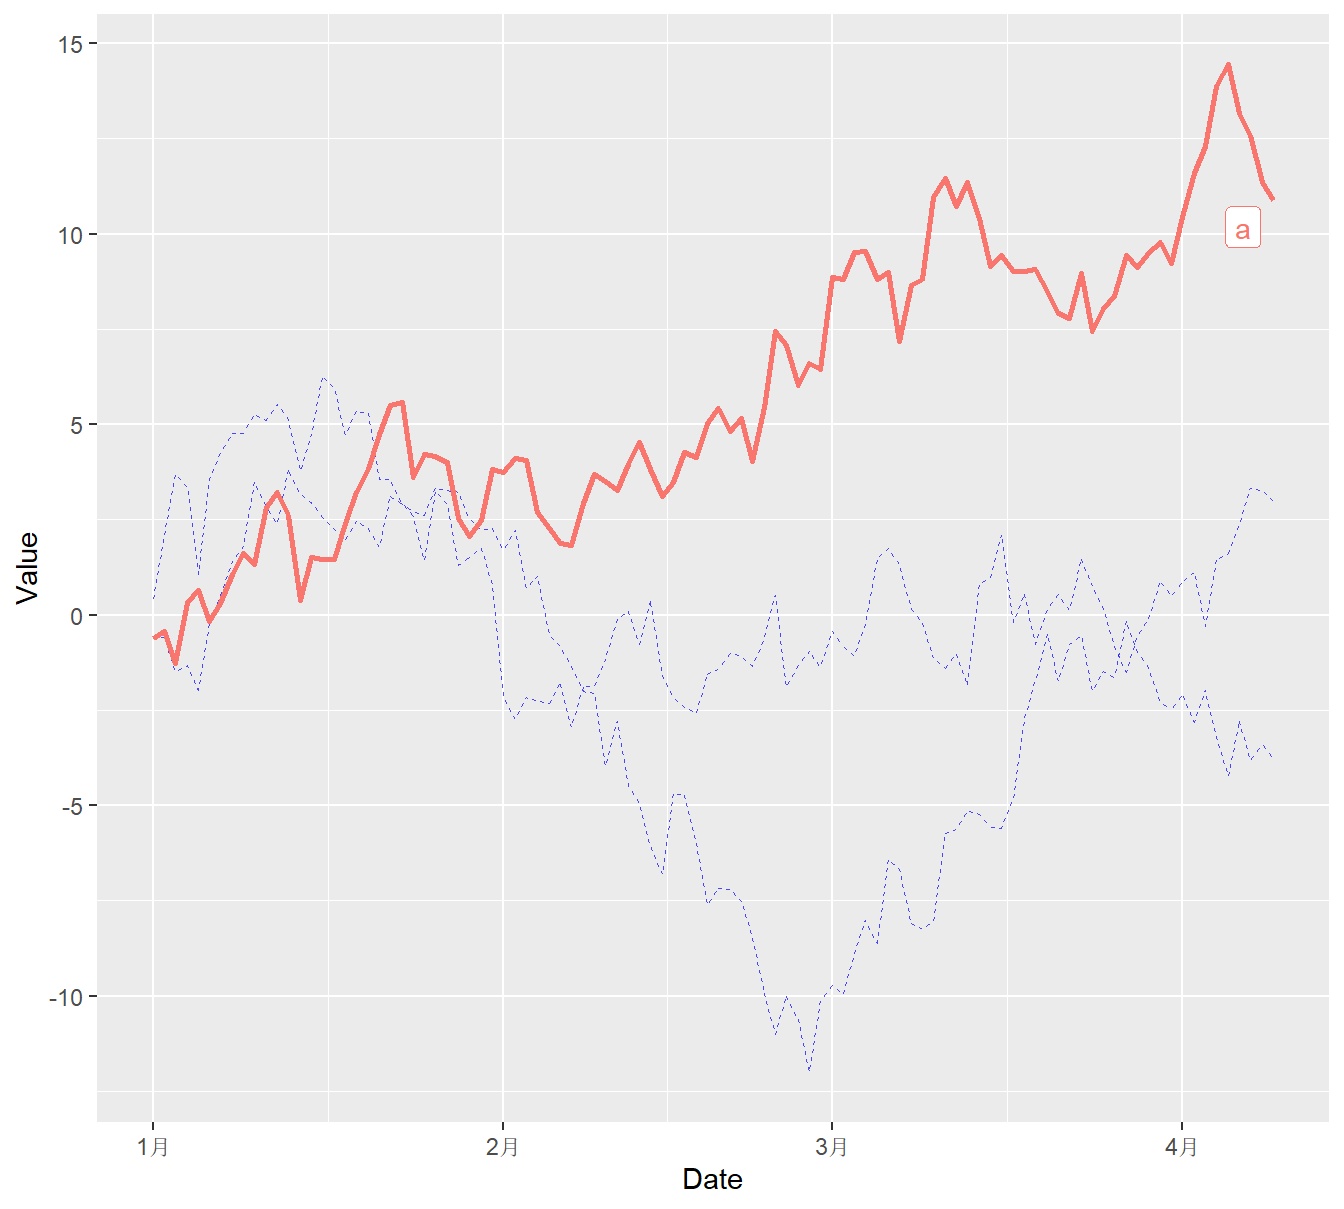
7.3.1 自定义样式
library(gghighlight)
library(patchwork)
plot1 <-  ggplot(df) +
  geom_line(aes(Date, Value, colour = Type), linewidth=0.4, color='#4393C3') +
  gghighlight(max(Value) > 10,
              unhighlighted_params = list(linewidth = 0.3,
                                          colour = alpha("darkred", 0.7),
                                          linetype = "dotted"),
              use_direct_label = FALSE) +
  theme_bw() + xlab("") + ylab("")

plot2  <-  ggplot(df) +
  geom_line(aes(Date, Value, colour = Type), linewidth=0.4, color='#4393C3') +
  gghighlight(min(Value) < -10,
              unhighlighted_params = list(linewidth = 0.3,
                                          colour = alpha("darkred", 0.7),
                                          linetype = "dotted"),
              use_direct_label = FALSE) +
  theme_bw()

plot1 / plot2 + plot_annotation(title = 'This chart is built with gghighlight')
7.4 分面线型图
data <- babynames %>%
  filter(name %in% c("Mary","Emma", "Ida", "Ashley", "Amanda", "Jessica",    "Patricia", "Linda", "Deborah",   "Dorothy", "Betty", "Helen")) %>%
  filter(sex=="F")

tmp <- data %>%
  mutate(name2=name)

tmp %>%
  ggplot( aes(x=year, y=n)) +
    geom_line( data=tmp %>% dplyr::select(-name), aes(group=name2), color="grey", size=0.5, alpha=0.5) +
    geom_line( aes(color=name), color="#69b3a2", size=1.2 )+
    scale_color_viridis(discrete = TRUE) +
    theme_ipsum() +
    theme(
      legend.position="none",
      plot.title = element_text(size=14),
      panel.grid = element_blank()
    ) +
    ggtitle("A spaghetti chart of baby names popularity") +
    facet_wrap(~name)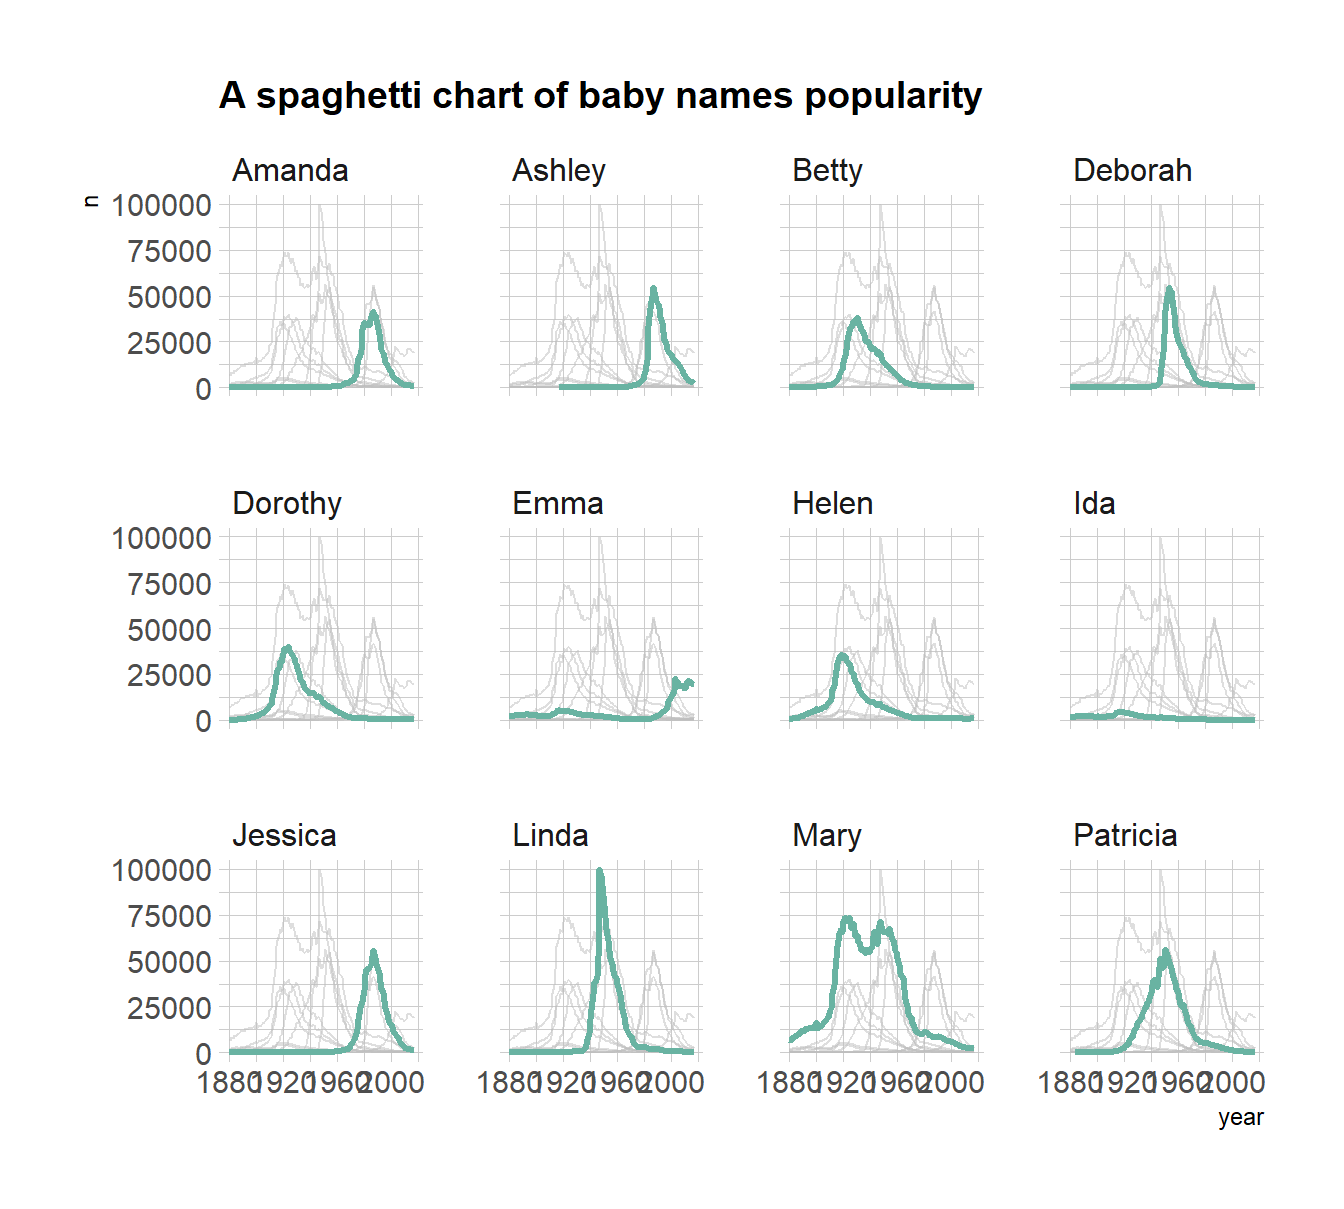
7.5 双Y轴线型图
library(patchwork)  # To display 2 charts together
data <- data.frame(
  day = as.Date("2019-01-01") + 0:99,
  temperature = runif(100) + seq(1,100)^2.5 / 10000,
  price = runif(100) + seq(100,1)^1.5 / 10
)

# Most basic line chart
p1 <- ggplot(data, aes(x=day, y=temperature)) +
  geom_line(color="#69b3a2", size=2) +
  ggtitle("Temperature: range 1-10") +
  theme_ipsum()

p2 <- ggplot(data, aes(x=day, y=price)) +
  geom_line(color="grey",size=2) +
  ggtitle("Price: range 1-100") +
  theme_ipsum()

# patchwork package
p1 + p2
合并到一张图
# Value used to transform the data
coeff <- 10

# A few constants
temperatureColor <- "#69b3a2"
priceColor <- rgb(0.2, 0.6, 0.9, 1)

ggplot(data, aes(x=day)) +

  geom_line( aes(y=temperature), size=2, color=temperatureColor) +
  geom_line( aes(y=price / coeff), size=2, color=priceColor) +

  scale_y_continuous(

    # Features of the first axis
    name = "Temperature (Celsius °)",

    # Add a second axis and specify its features
    sec.axis = sec_axis(~.*coeff, name="Price ($)")
  ) +

  theme_ipsum() +

  theme(
    axis.title.y = element_text(color = temperatureColor, size=13),
    axis.title.y.right = element_text(color = priceColor, size=13)
  ) +

  ggtitle("Temperature down, price up")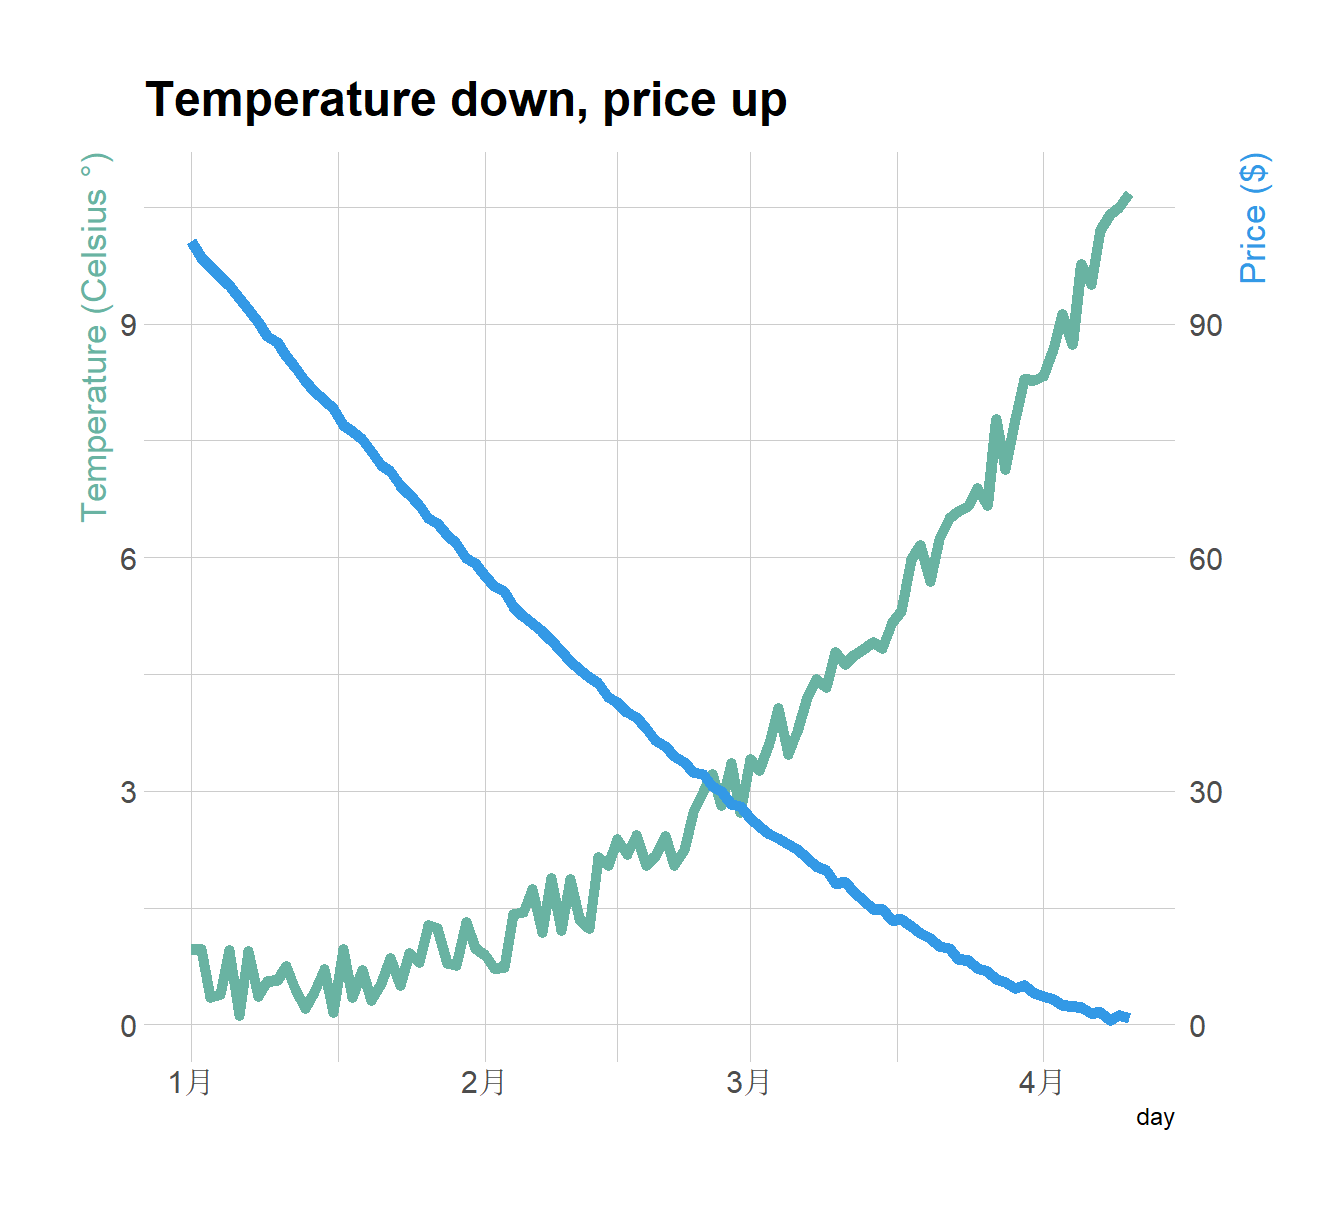
7.6 带折线图的条形图
# Value used to transform the data
coeff <- 10

# A few constants
temperatureColor <- "#69b3a2"
priceColor <- rgb(0.2, 0.6, 0.9, 1)

ggplot(head(data, 80), aes(x=day)) +

  geom_bar( aes(y=temperature), stat="identity", size=.1, fill=temperatureColor, color="black", alpha=.4) +
  geom_line( aes(y=price / coeff), size=2, color=priceColor) +

  scale_y_continuous(

    # Features of the first axis
    name = "Temperature (Celsius °)",

    # Add a second axis and specify its features
    sec.axis = sec_axis(~.*coeff, name="Price ($)")
  ) +

  theme_ipsum() +

  theme(
    axis.title.y = element_text(color = temperatureColor, size=13),
    axis.title.y.right = element_text(color = priceColor, size=13)
  ) +

  ggtitle("Temperature down, price up")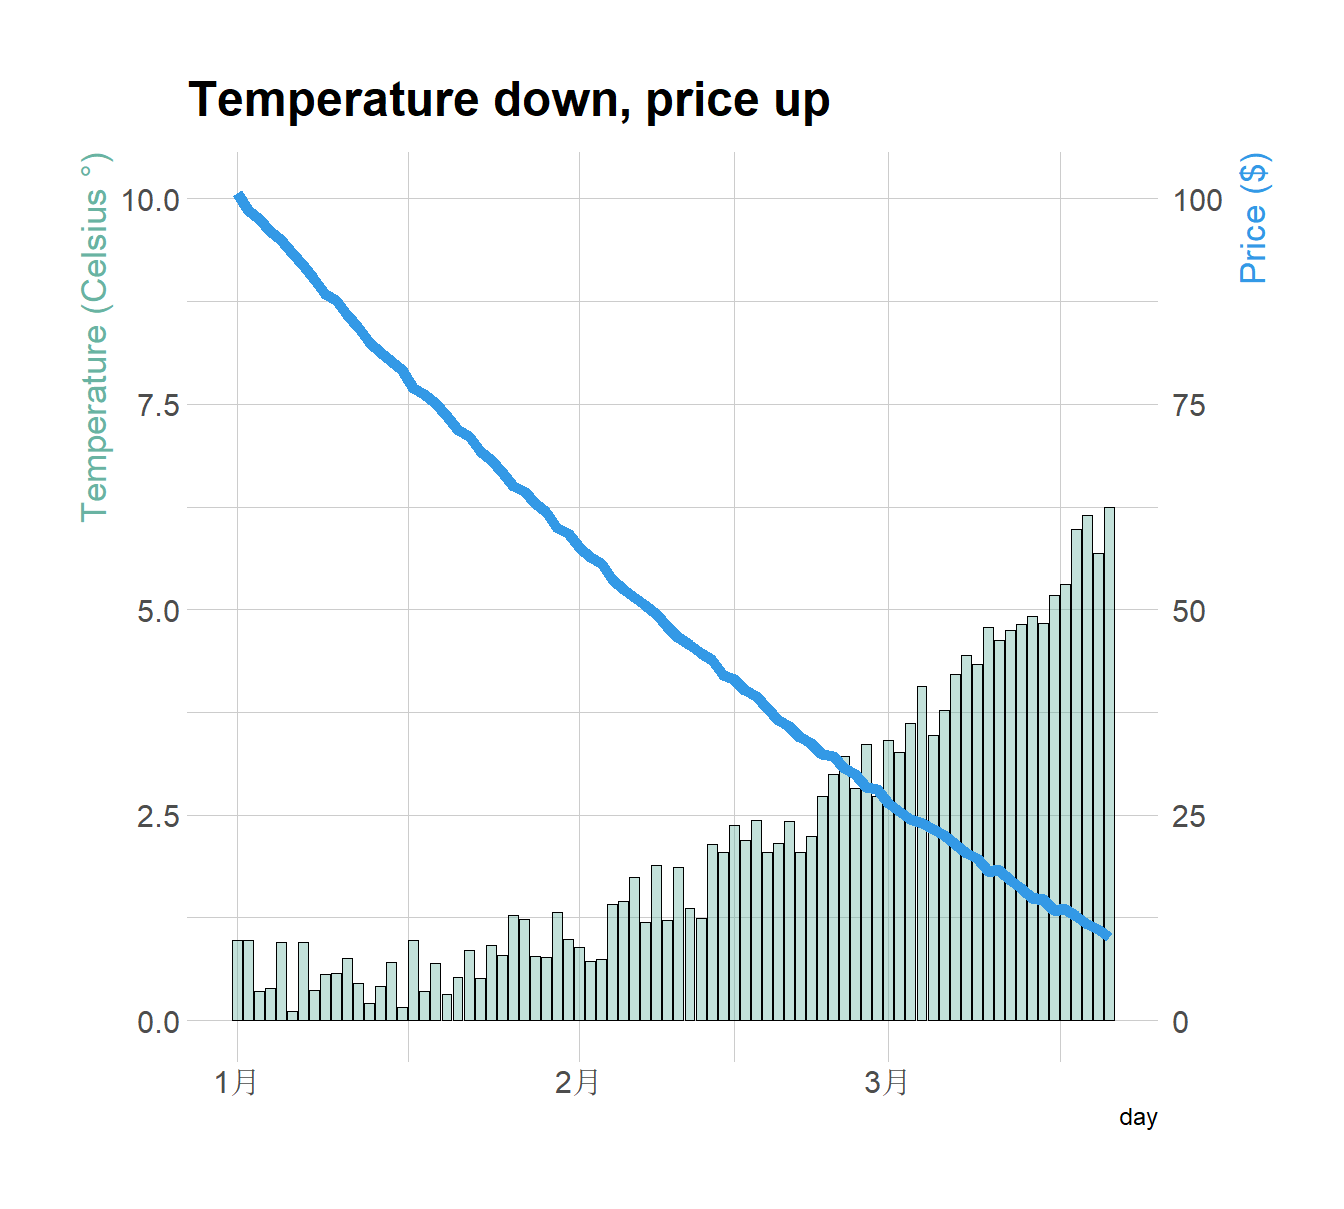
7.7 散点图连接
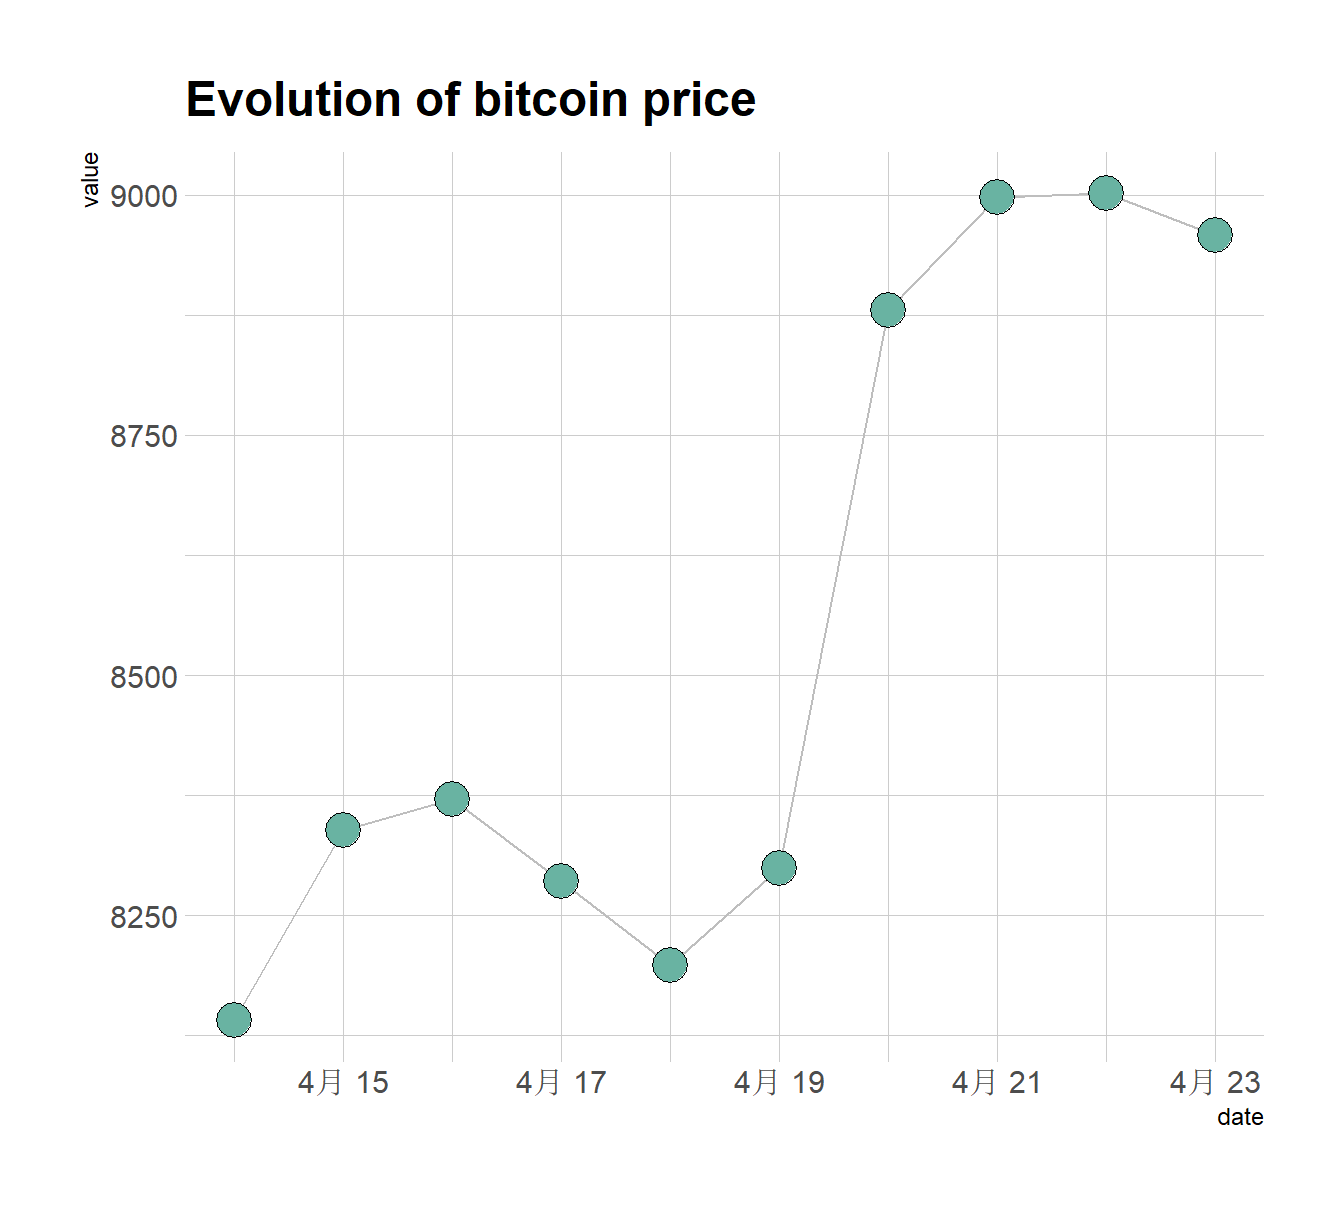
data <- read.csv("Datas/3_TwoNumOrdered.csv",header = T)
data$date <- as.Date(data$date)

# Plot
data %>%
  tail(10) %>%
  ggplot( aes(x=date, y=value)) +
    geom_line( color="grey") +
    geom_point(shape=21, color="black", fill="#69b3a2", size=6) +
    theme_ipsum() +
    ggtitle("Evolution of bitcoin price")