第 4 章 小提琴图
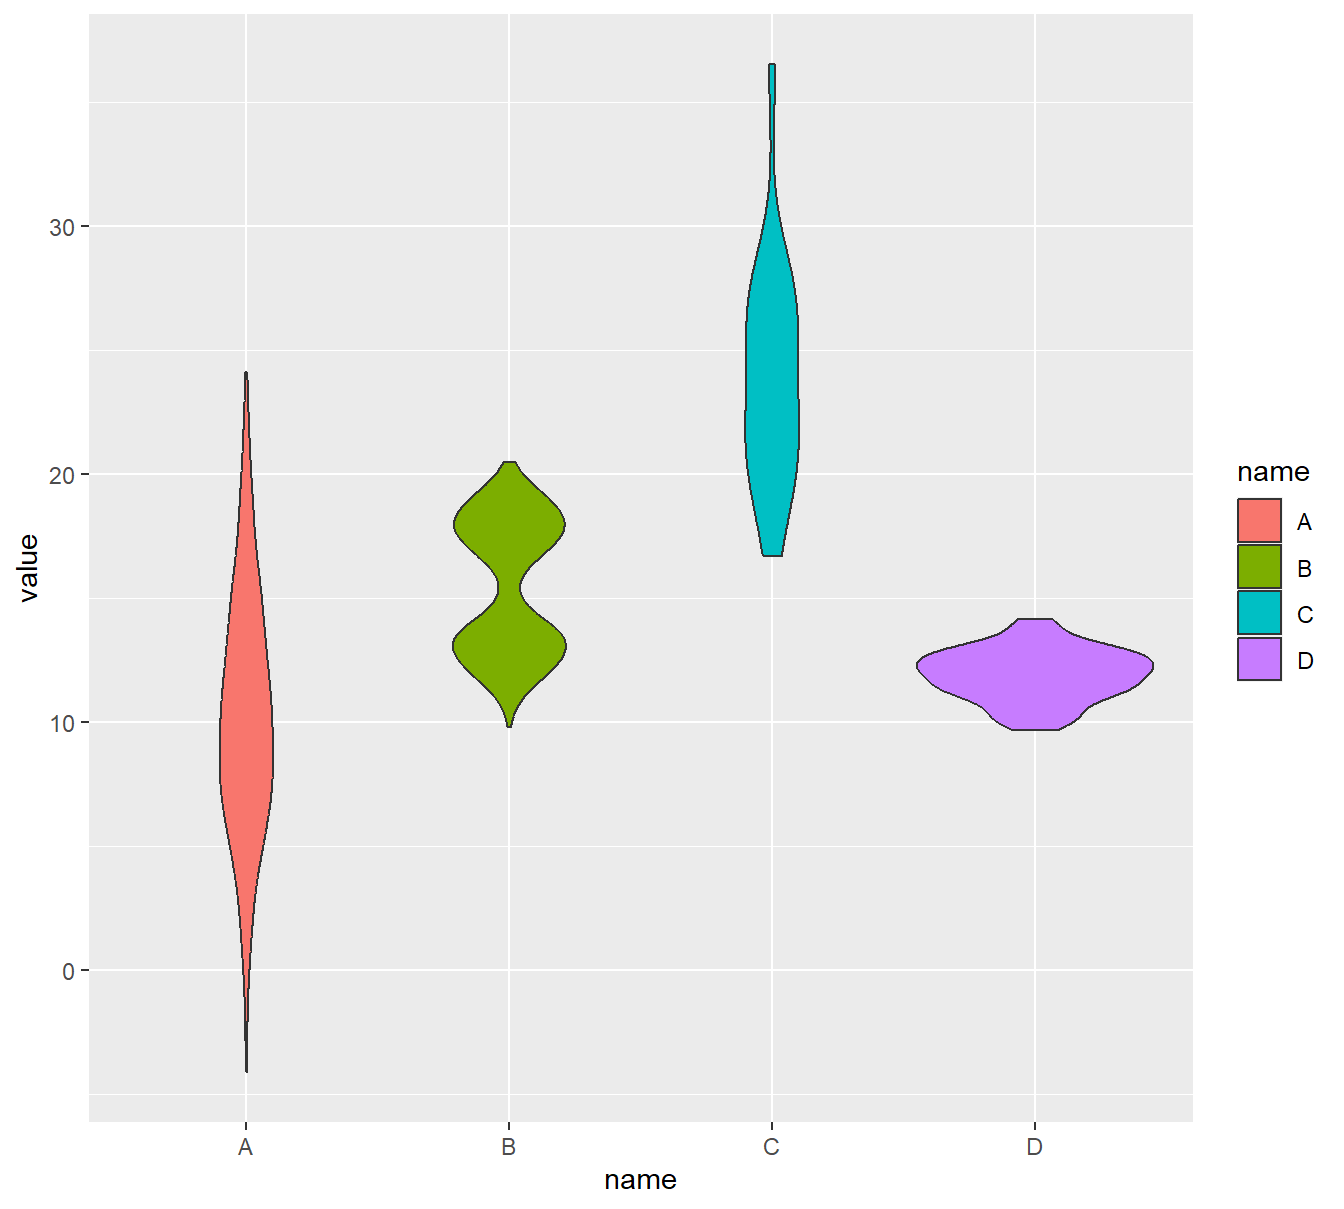
4.1 基本小提琴图
data <- data.frame(
  name=c( rep("A",500), rep("B",500), rep("B",500), rep("C",20), rep('D', 100)  ),
  value=c( rnorm(500, 10, 5), rnorm(500, 13, 1), rnorm(500, 18, 1), rnorm(20, 25, 4), rnorm(100, 12, 1) )
)

# Most basic violin chart
ggplot(data, aes(x=name, y=value, fill=name)) + # fill=name allow to automatically dedicate a color for each group
  geom_violin()
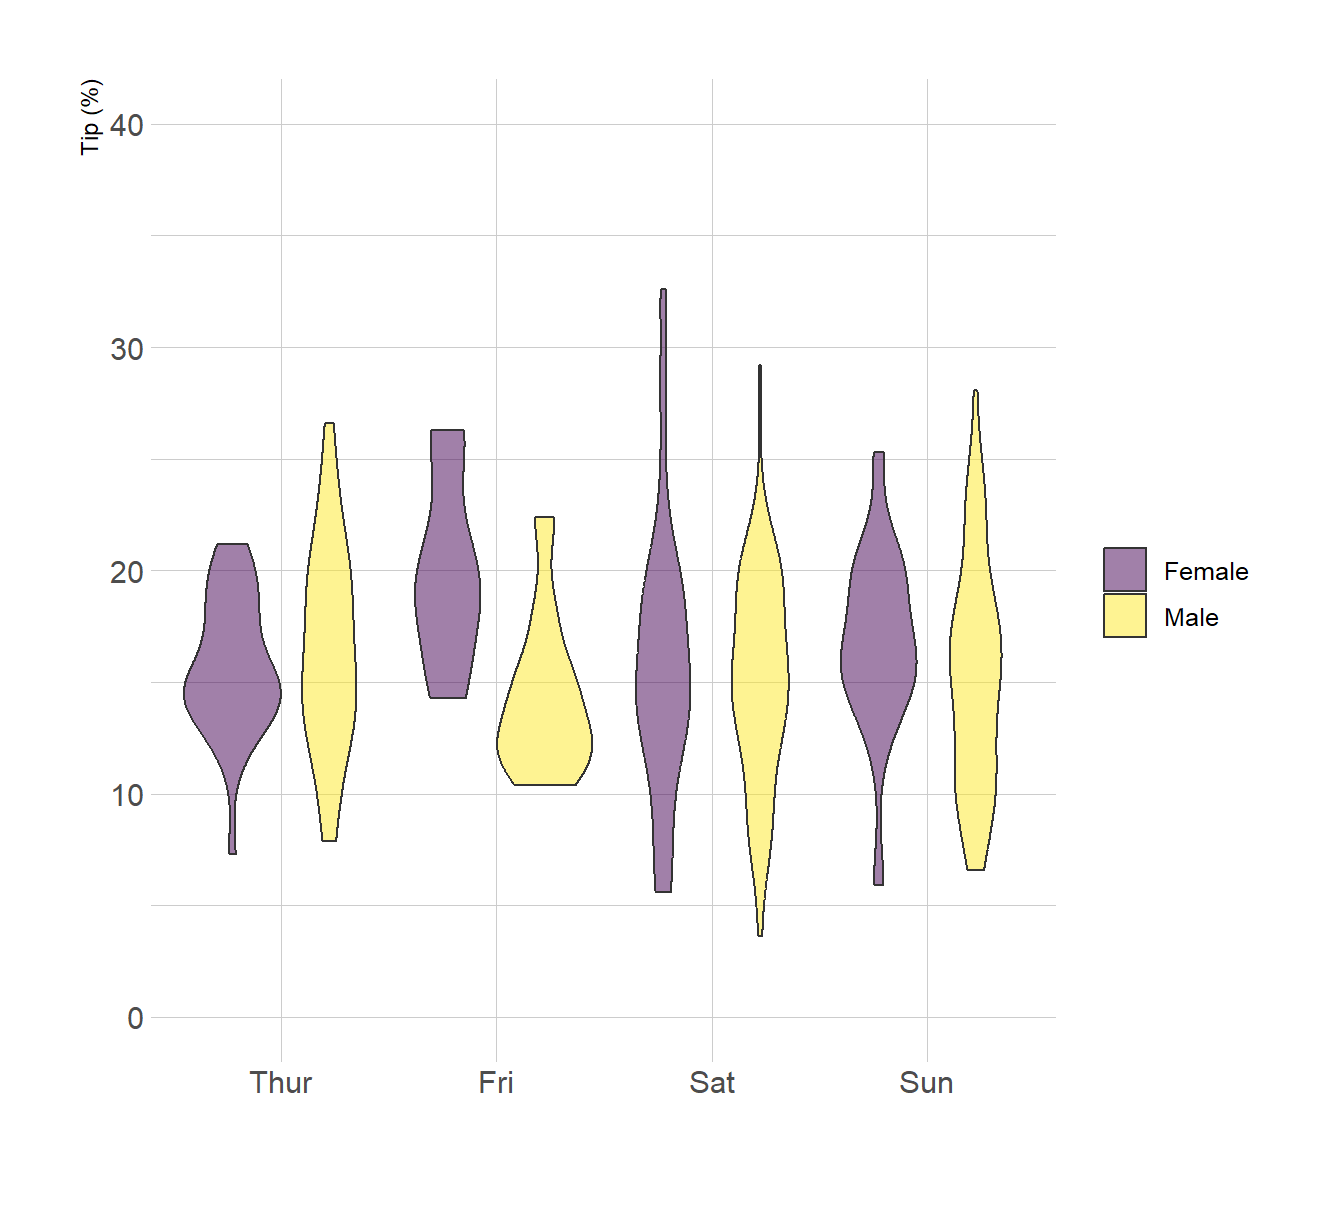
4.2 分组小提琴图
data <- read.table("Datas/10_OneNumSevCatSubgroupsSevObs.csv", header=T, sep=",") %>%
  mutate(tip = round(tip/total_bill*100, 1))

# Grouped
data %>%
  mutate(day = fct_reorder(day, tip)) %>%
  mutate(day = factor(day, levels=c("Thur", "Fri", "Sat", "Sun"))) %>%
  ggplot(aes(fill=sex, y=tip, x=day)) +
    geom_violin(position="dodge", alpha=0.5, outlier.colour="transparent") +
    scale_fill_viridis(discrete=T, name="") +
    theme_ipsum()  +
    xlab("") +
    ylab("Tip (%)") +
    ylim(0,40)
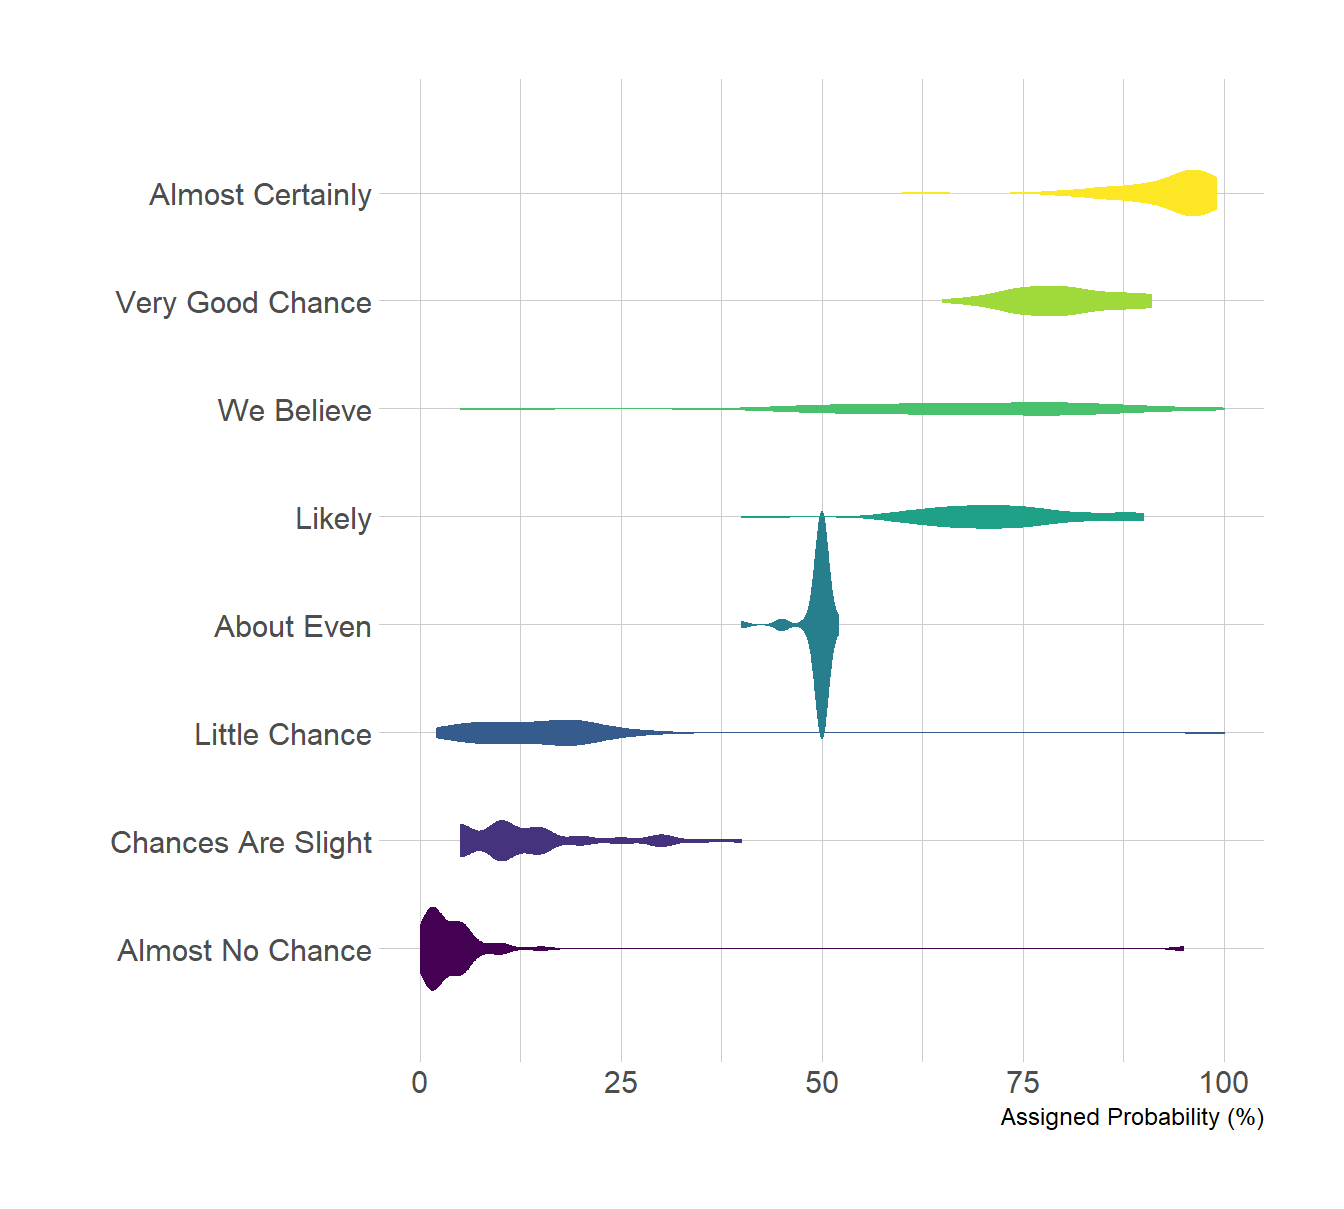
4.3 水平小提琴图
data <- read.table("Datas/probly.csv", header=TRUE, sep=",")

# Data is at wide format, we need to make it 'tidy' or 'long'
data <- data %>%
  gather(key="text", value="value") %>%
  mutate(text = gsub("\\.", " ",text)) %>%
  mutate(value = round(as.numeric(value),0)) %>%
  filter(text %in% c("Almost Certainly","Very Good Chance","We Believe","Likely","About Even", "Little Chance", "Chances Are Slight", "Almost No Chance"))

# Plot
data %>%
  mutate(text = fct_reorder(text, value)) %>% # Reorder data
  ggplot( aes(x=text, y=value, fill=text, color=text)) +
    geom_violin(width=2.1, linewidth=0.2) +
    scale_fill_viridis(discrete=TRUE) +
    scale_color_viridis(discrete=TRUE) +
    theme_ipsum() +
    theme(
      legend.position="none"
    ) +
    coord_flip() + # This switch X and Y axis and allows to get the horizontal version
    xlab("") +
    ylab("Assigned Probability (%)")
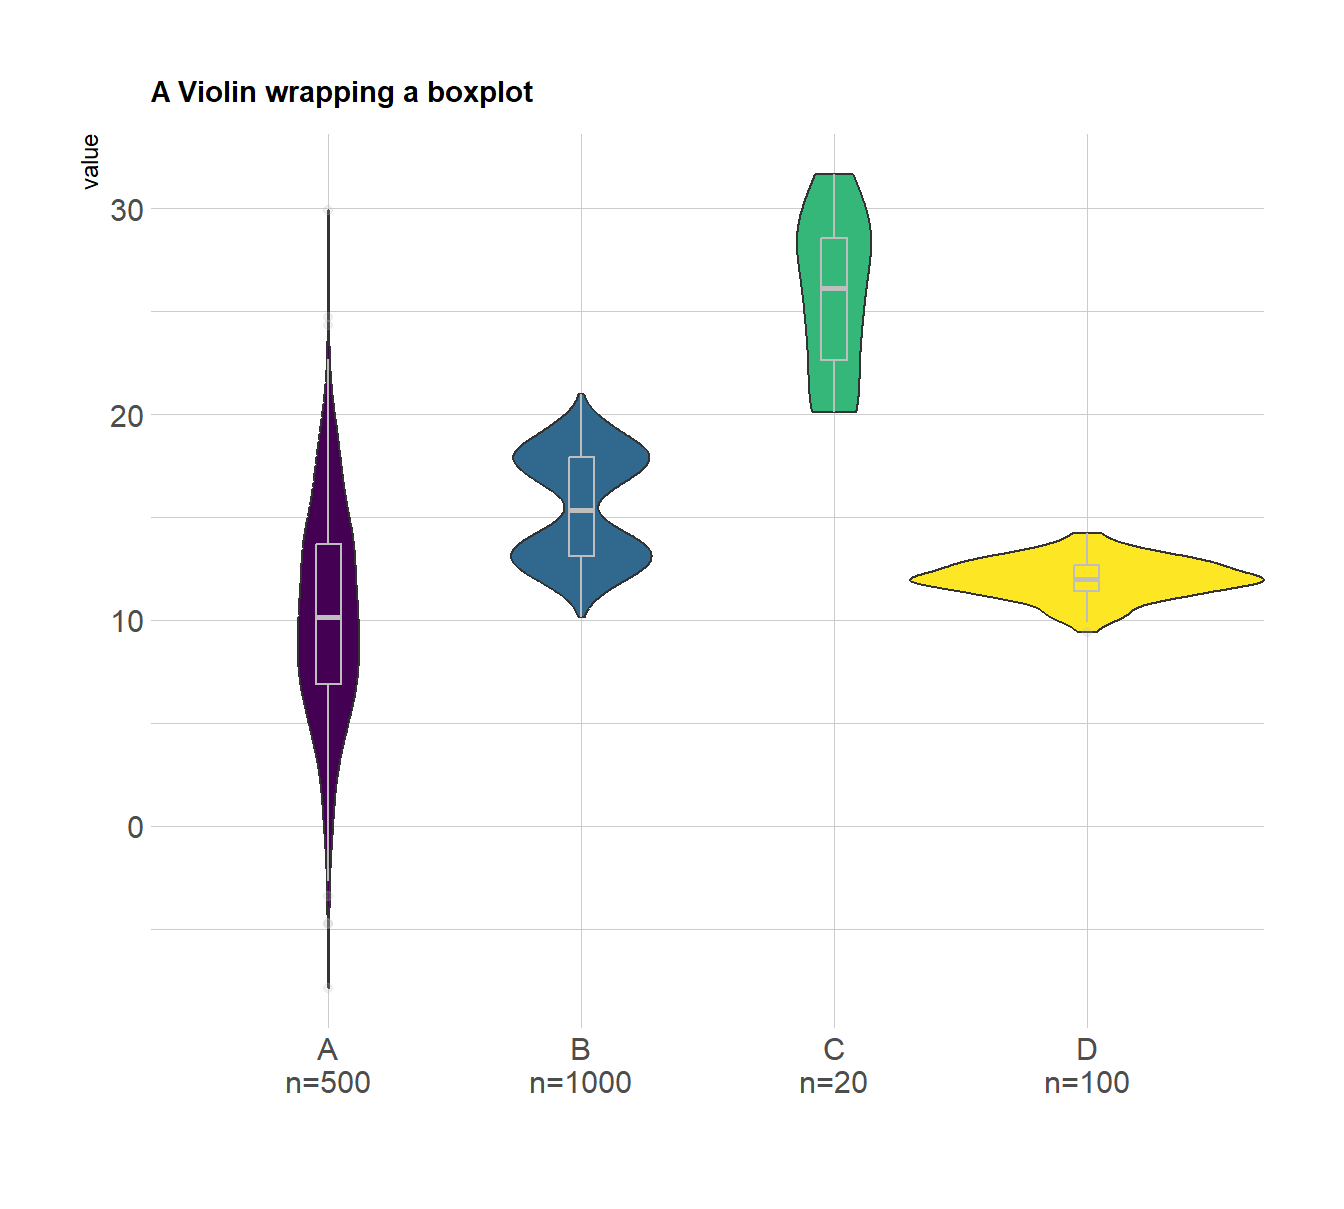
4.4 带箱型和样本量的小提琴图
data <- data.frame(
  name=c( rep("A",500), rep("B",500), rep("B",500), rep("C",20), rep('D', 100)  ),
  value=c( rnorm(500, 10, 5), rnorm(500, 13, 1), rnorm(500, 18, 1), rnorm(20, 25, 4), rnorm(100, 12, 1) )
)

# sample size
sample_size <-  data %>% group_by(name) %>% summarize(num=n())

# Plot
data %>%
  left_join(sample_size) %>%
  mutate(myaxis = paste0(name, "\n", "n=", num)) %>%
  ggplot( aes(x=myaxis, y=value, fill=name)) +
    geom_violin(width=1.4) +
    geom_boxplot(width=0.1, color="grey", alpha=0.2) +
    scale_fill_viridis(discrete = TRUE) +
    theme_ipsum() +
    theme(
      legend.position="none",
      plot.title = element_text(size=11)
    ) +
    ggtitle("A Violin wrapping a boxplot") +
    xlab("")